Your first chart
With Highcharts Flutter included in your app (See getting started) you are ready to create your first chart.
We will start off by creating a simple bar chart.
Add a
HighchartsChartwidget in your app.Give it a title and set a specific width and or height for your chart.
@overrideWidget build(BuildContext context) {return MaterialApp(title: 'My First Chart',theme: ThemeData(colorScheme: ColorScheme.fromSeed(seedColor: Colors.deepPurple),useMaterial3: true,),home: Scaffold(appBar: AppBar(backgroundColor: Theme.of(context).colorScheme.inversePrimary,title: const Text('My First Chart'),),body: SafeArea(child: Scrollbar(child: ListView(children: [// Here the HighchartsChart widget is added to a ListViewHighchartsChart(HighchartsOptions(title: HighchartsTitleOptions(text: 'Fruit Consumption',),chart: HighchartsChartOptions(backgroundColor: '#FFF0',height: 400),xAxis: [HighchartsXAxisOptions(categories: ['Monday', 'Wednesday', 'Friday'],),],series: [],),),],))),),);}In this step we add two series with data to the
HighchartsChartwidget.You can provide each data point as a list of axes values.
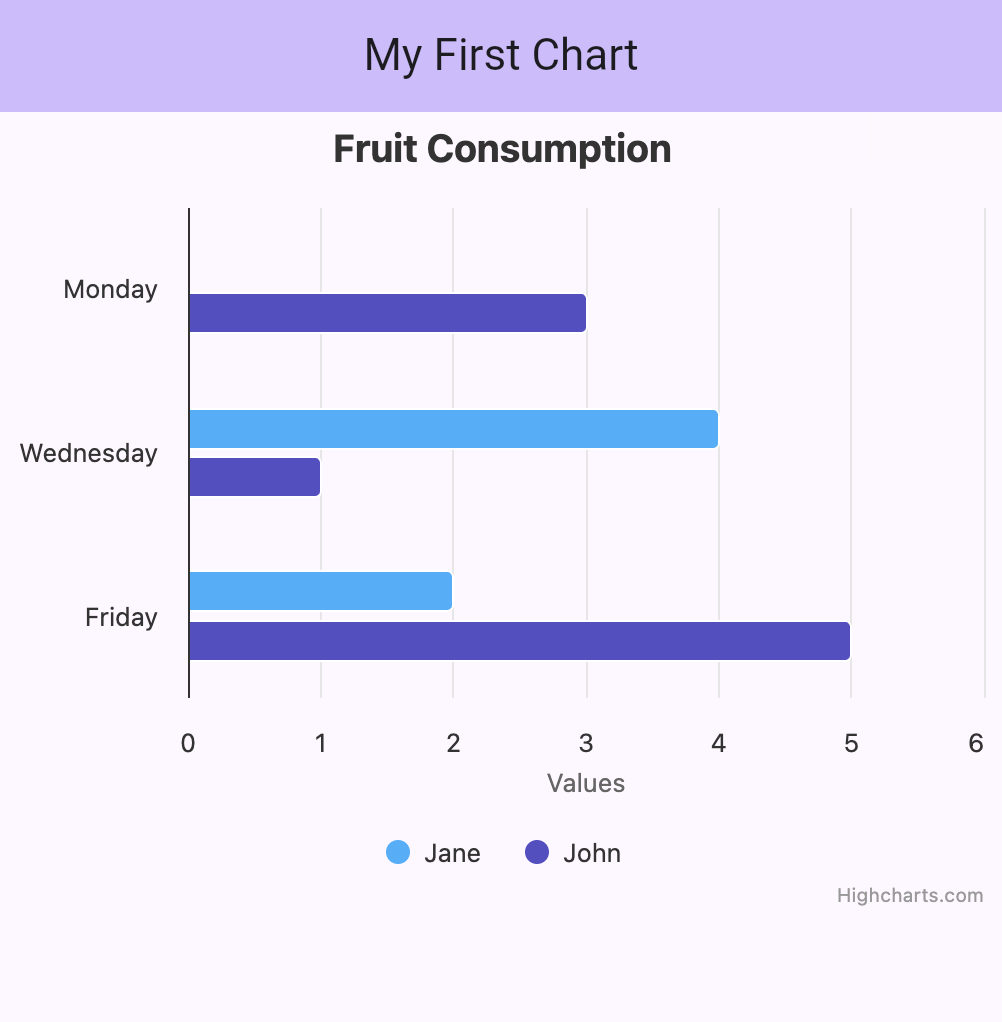
HighchartsOptions(// ...series: [HighchartsBarSeries(name: 'Jane',data: [['Monday', 0],['Wednesday', 4],['Friday', 2],],),],)Or you can provide each data point as an complex object.
HighchartsOptions(// ...series: [// ...HighchartsBarSeries(name: 'John',dataPoints: [HighchartsBarSeriesDataOptions(name: 'Monday',y: 3,),HighchartsBarSeriesDataOptions(name: 'Wednesday',y: 1,),HighchartsBarSeriesDataOptions(name: 'Friday',y: 5,),],),],)Additional series options are added separately.
HighchartsOptions(// ...series: [HighchartsBarSeries(name: 'Jane',// ...options: HighchartsBarSeriesOptions(color: 'coral' // or '#ff7f50'),),HighchartsBarSeries(name: 'John',// ...options: HighchartsBarSeriesOptions(color: 'deepskyblue' // or '#00bfff'),),],),Your chart should look similar to the following picture.
Adjusting legend and series tooltips is also an easy task and allows you to change appearance and interaction.
HighchartsOptions(// ...legend: HighchartsLegendOptions(enabled: true,layout: 'horizontal',align: 'center',verticalAlign: 'bottom',),tooltip: HighchartsTooltipOptions(enabled: true,shared: true,valueSuffix: ' pcs',),),One can also add callbacks to be informed about interactions and other events.
HighchartsOptions(// ...plotOptions: HighchartsPlotOptions(series: HighchartsSeriesOptions(point: HighchartsSeriesPointOptions(events: HighchartsSeriesEventsOptions(click: HighchartsCallback((args) {final point = args[0];debugPrint('Point value: ${point['x']}, ${point['y']}');}),),),),),),Congratulations! With everything in place you can create stunning interactive charts in your app.
For more information about all available options, consult our API docs or the package docs.