Highcharts® Dashboards
Don’t start from scratch. With built-in data synchronization, ready-made components and completely customizable options, Highcharts Dashboards does all the heavy lifting out of the box, saving you valuable time on your dashboard projects.
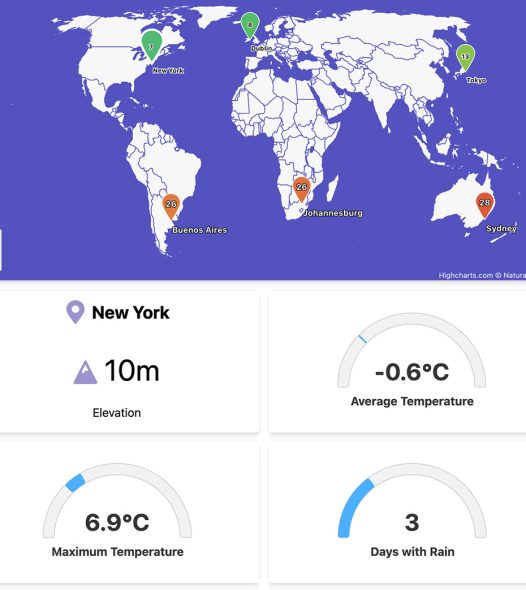
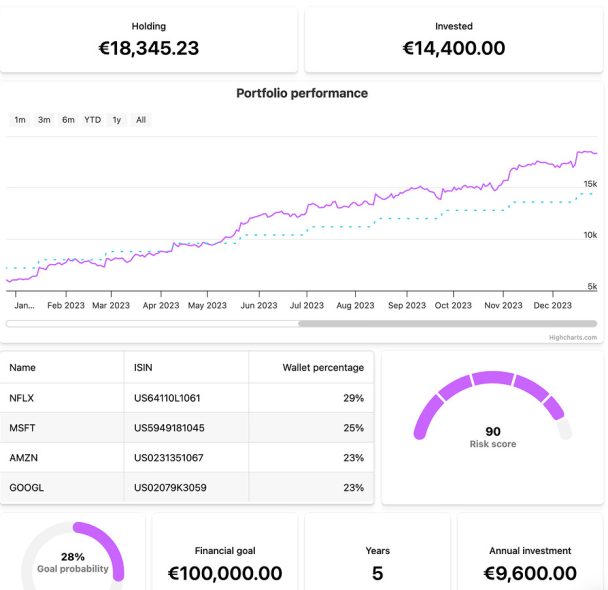
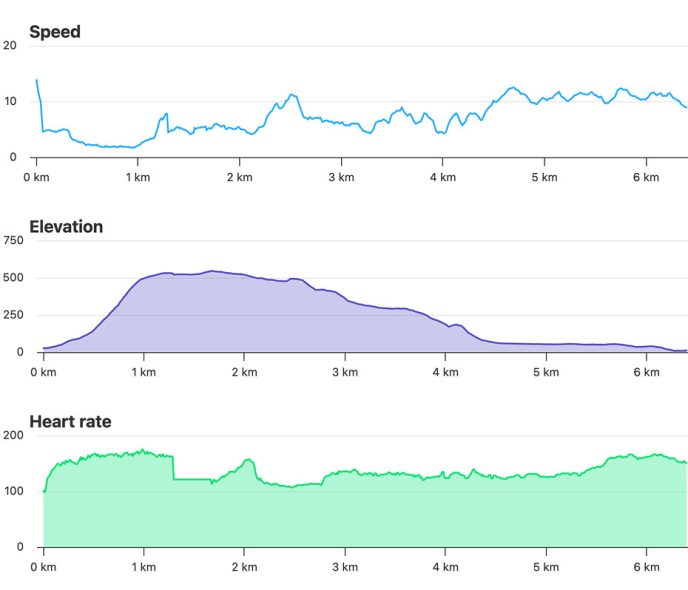
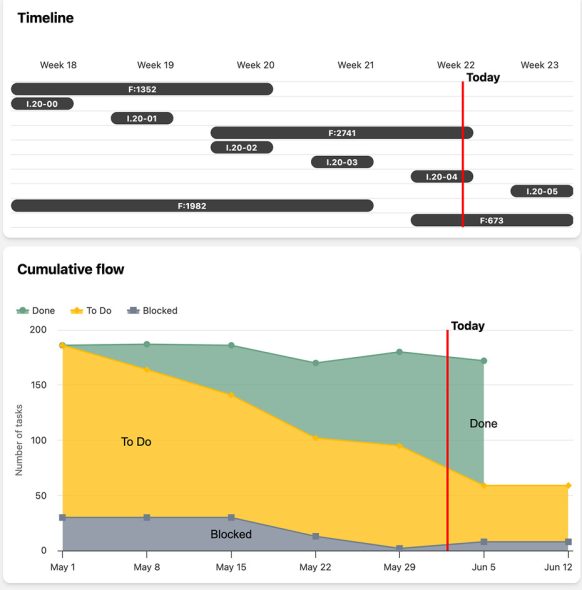
Popular Dashboard Demos
Made by Developers for Developers
Don’t waste time coding from scratch. Highcharts Dashboards is a development library pre-loaded with time-saving features that will save you hours of development time on your dashboard projects.


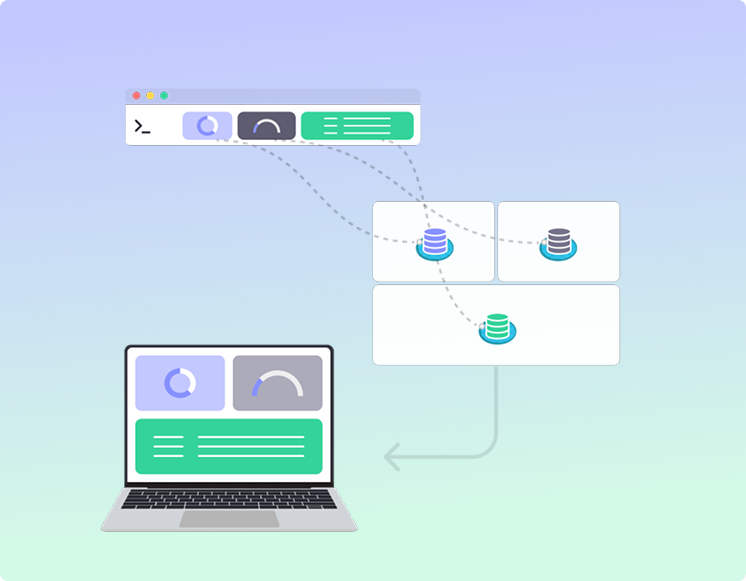
How Highcharts Dashboards Works
1.
Install via npm or use our CDN. See all download options.
2.
Centralize data access by connecting your data sources to the data pool. Use our pre-built connectors or build your own.
3.
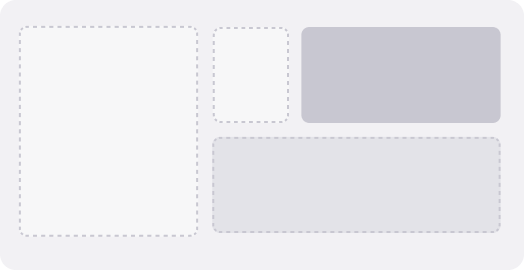
Define your layout with our Flexbox-based layout engine that calculates the position of components and automatically puts them where they need to be.
4.
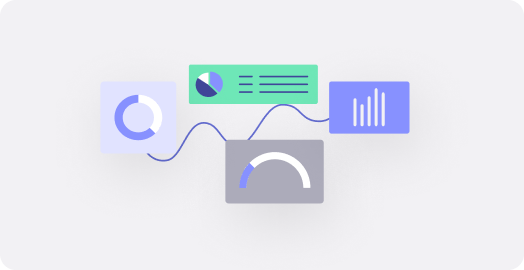
Connect your components to your data pool and layout. Once connected, you can specify the behaviors you want to sync across components.
5.
Launch your dashboard within an existing app or as a stand-alone web page. Once live, end users can rearrange components via intuitive drag and drop.
Add powerful data grids to your dashboards with Highcharts Grid
Highcharts Grid is a powerful, lightweight, fully customizable solution for managing and visualizing tabular data. It works great on its own, but it really shines when used as part of a Highcharts Dashboards. Use them together to organize, explore and present complex data.