Note. Since the release of this article, Highcharts Gantt has gone into production. Please read the announcement about Highcharts Gantt v1, and the Gantt product page for the latest version.
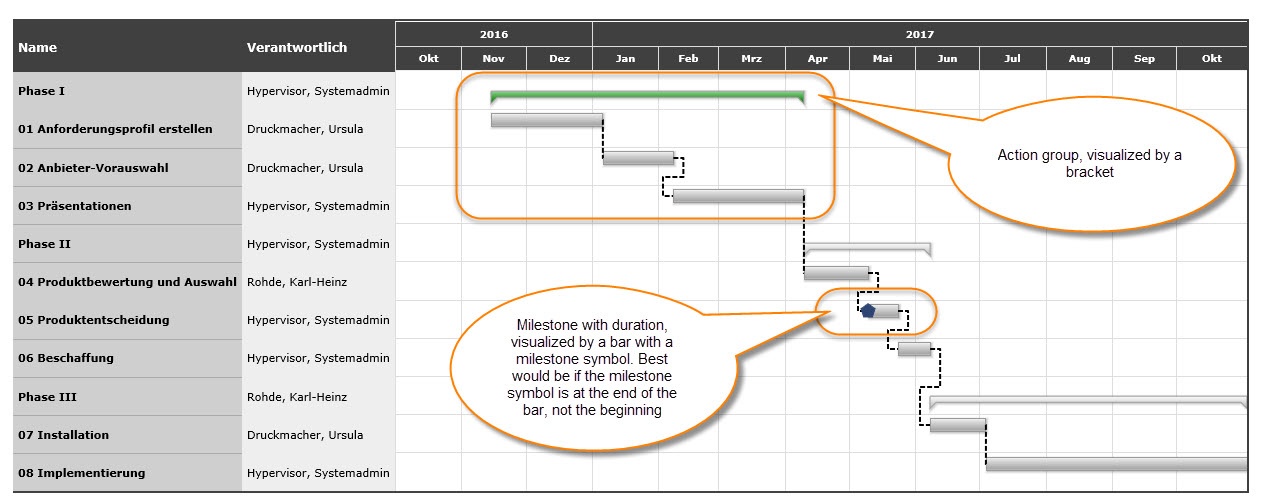
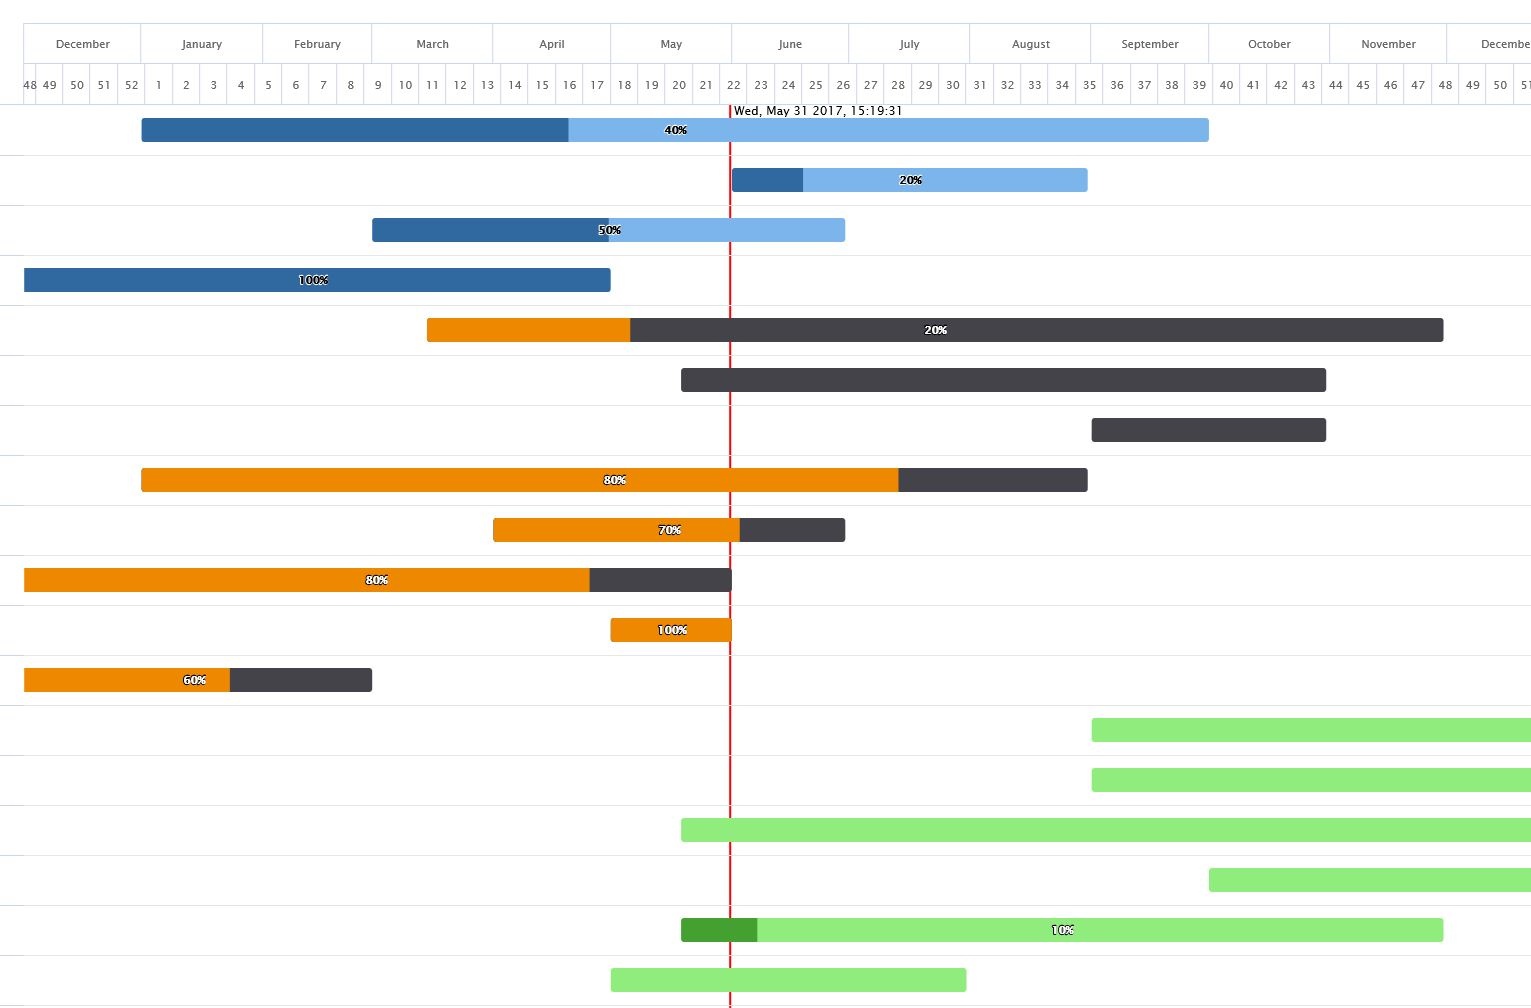
For the last six months or so, we’ve been working on a new Highcharts product. Today, we’re proud to announce that Highcharts Gantt is in alpha! Highcharts Gantt is a JavaScript library that extends Highcharts for easy creation of Gantt charts. It will be offered as a separate product, just like Highstock and Highmaps. Haven’t heard of Gantt, you say? Click here to read more; the same link is also available for the accessibility community here. For a live demo check the following demo JSFiddle demo.
Where to download?
The Highcharts Gantt alpha version can be downloaded here.
Can I test it?
Of course! Please do. Create Gantt charts based on your own data to see how usable it is and how it performs. We would love to hear whether it meets your use-cases. Feel free to submit your chart to our community pages, as well. Any feedback with big or small issues with naming, structure, design, performance or otherwise can be commented here on this post. You can also submit issues on GitHub, but we ask you not to clutter the GitHub issues with too many discussions about Gantt yet. We ask that you describe the problem as detailed as possible, preferably accompanied by a minimal example of the problem on JSFiddle or similar.
Parts
Highcharts Gantt consists of several modules, which extend the normal Highcharts looks and behavior:
Module | Description |
GridAxis | Makes axes look like table rows or cells |
TreeGrid | Adds tree behavior to y-axes. Inherits grid behavior from GridAxis |
Pathfinder | Adds lines with auto-calculated paths from one point to another (used for dependencies in Highcharts Gantt) |
CurrentDateIndicator | Adds a plot line at the current date and displays it in the plot line label |
ArrowSymbols | An icon-pack for the Highcharts renderer, adding more arrow-symbols |
XRangeSeries | Multiple points with the same y-value with two x-values (start and end), and partial color filling (used to display completeness) |
GanttSeries | The series type used in a Gantt chart, with many aliases for Highcharts options, which are more Gantt-friendly |
GanttChart | Adds the Highcharts.ganttChart()-constructor which creates two datetime x-axes on top of the chart with weeks and days in granularity, creates one treegrid y-axis, and sets the default series type to ‘gantt’ |
Current status
Gantt has been considered nearly Alpha-ready for a while, but was delayed due to some issues that appeared during testing with TreeGrid and datasets that had not been used before. TreeGrid fundamentally changes how the data is viewed and treated, and this is why the issues only emerged so late in development. Furthermore, the addition of applying a static scale to a Gantt chart proved problematic due to the order of positioning and rendering logic in Gantt.
As we are starting alpha testing, the API, features, and functionality are all open for negotiation. There are probably bugs, performance issues and design concerns that we have not addressed, but this is why we test.
Known issues
Below follows a list of known issues at this time, categorized into the different modules being used in Gantt. Any thoughts or further elaborations of a problem is welcome.
GanttSeries
- Does not yet aggregate data from subtasks to parent tasks. For example, start and end dates could be calculated based on information from subtasks
TreeGrid
- The arrows on parent nodes are not yet clickable.
- There is yet no API for triggering a collapse or expand yet. The following methods will be attached to an appropriate object: `collapse()`, `expand()`, `toggleCollapse()` and `isCollapsed()`.
- There is yet no system for creating a table with the TreeGrid.
- Cannot yet be applied to x-axis
Pathfinder
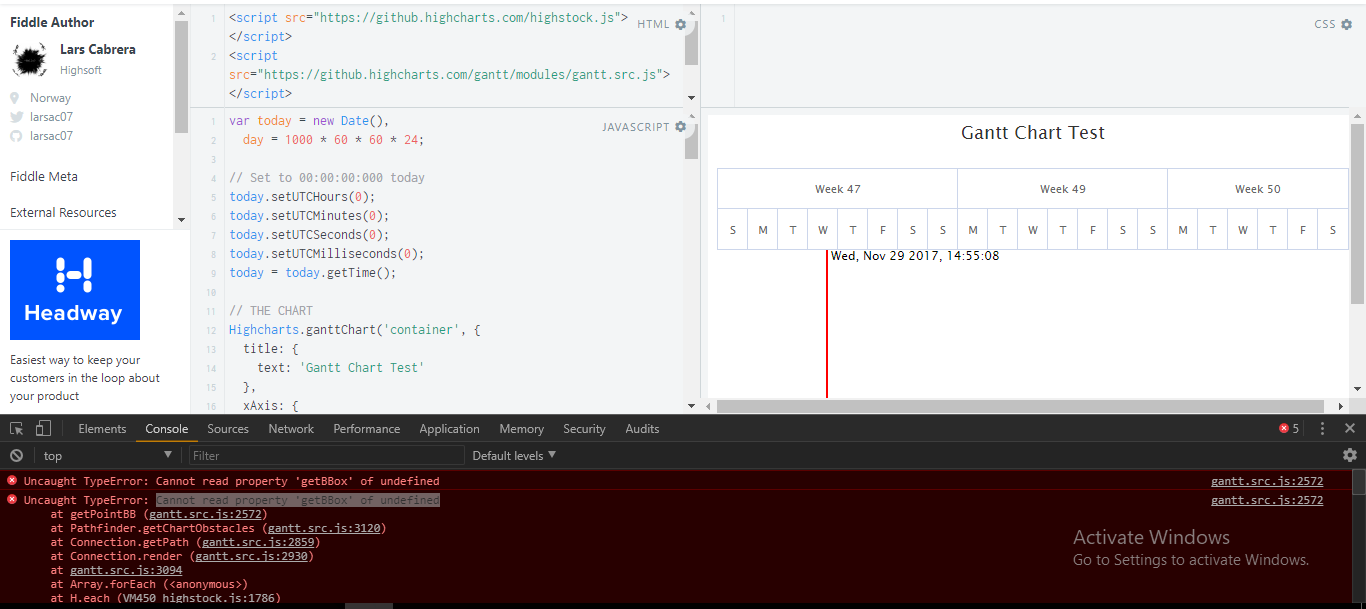
- The `fastAvoid` algorithm in Pathfinder crashes when collapsing/expanding a tree grid, or showing/hiding a series. Seems to have to do with animation.
- Pathfinder markers:
- Rendered underneath points, causing the point stroke to make the markers appear cropped.
- Often positioned slightly incorrect (≈±1px) in relation to the path, making them look skewed.
- The ‘fastAvoid’-algorithm sometimes chooses to go around the starting point before approaching the end point.
- Paths do not animate when the chart changes.
- When collapsing, path positions are not updated, leaving them mispositioned
CurrentDateIndicator
The time in the label does not update itself yet, but waits for the axis to be rendered, which happens every time the chart size is altered
Data Format
The current data format is explained below with the syntax used in api.highcharts.com.
// The ganttChart() constructor comes with a set of predefined values // for x- and y-axes, making the necessary configuration smaller Highcharts.ganttChart('container', { xAxis: { // The current-date-indicator. currentDateIndicator: true, // Min and max on both x-axes min: Date(), max: Date() }, series: [{ data: [{ // Display name of task taskName: 'Inspect building', // Reference id for tasks which depends on, or are // children of, this task. id: 'inspect_building', // Depends on a task with id: 'prepare_building'. dependency: 'prepare_building', // The parent task of this task is 'new_offices'. parent: 'new_offices', // Whether or not this is a milestone. Milestones are // rendered as diamonds (square rotated 45º). milestone: false // Start and end dates. If milestone, end date is // ignored. start: Date(2017, 3, 7), end: Date(2017, 3, 25), // Adds a partial fill with configurable fill and // stroke. Amount is 0.1-1.0. Value can also be simply // a number, using default values (completed: 0.2). completed: { amount: 0.2, fill: '#FFAA00' } // The usually required y-value is auto-calculated // after the point's position in the tree(s). }] }] });
Comments
Ralf Guttmann | 7 years ago
https://uploads.disquscdn.com/images/d43f5b53d280f1930d5c148255d480bfe1a91906919a2f9d421da4240af93d2c.jpg
We are using gantt charts (from fusion charts) already a couple of years and find it absolutely necessary that a milestone is not limited to just one day but has a duration between a start and an end date. From my experience from a lot of projects with customers this is a crucial feature. Another this is that the action groups should be visualized as a bracket to show a difference to a normal action. See sceen shot for example. We really would like to change from fusion charts to highcharts because we are already using the high charts library very succfesfully.
Lars Cabrera | 7 years ago
Hi, Ralf.
Nice to know you’re interested in going with Highcharts 🙂
Milestones and tasks are two quite different elements of a Gantt chart. Milestones are by definition single points in time, but there is nothing in the way of having what you described: http://jsfiddle.net/larsac07/rh98v1f2/. However, there is currently an issue with using the same y-value on multiple points in a tree grid (we are after all still in alpha), resulting in milestones not being able to be rendered on top of tasks.
I agree that action groups (parent tasks) should perhaps be visualized in a different way than leaf-tasks, but I’m not too sure about the bracket-design. We’ll look into this.
Thanks for your feedback 🙂
Anup Patil | 6 years ago
I have integrated gantt chart in my code. How will I be notified when this issue will be resolved?
House Design | 7 years ago
Same trouble.
2018 calendar | 6 years ago
viewed and treated, and this is why the issues only emerged so late in development. Furthermore, the addition of applying a static scale to a Gantt chart proved problematic due to the order of positioning and rendering logic in Gantt.
nguyenthao88 | 7 years ago
when is gantt highchart final version?
Lars Cabrera | 7 years ago
Hi, nguyenthao88.
We’re aiming for beta during Q2-Q3, so we’ll see about the release date after that 🙂
motivation | 6 years ago
but we ask you not to clutter the GitHub issues with too many discussions about Gantt yet. We ask that you describe the problem as detailed as possible, preferably accompanied by a minimal example of the problem on JSFiddle or similar.
Anton Baranchuk | 6 years ago
Hi Ralf, have you seen AnyGantt? https://www.anychart.com/products/anygantt/gallery/
2017 calendar pdf | 6 years ago
Highcharts Gantt consists of several modules, which extend the normal Highcharts looks and behavior:
dunkoh | 7 years ago
Seems to be an issue with the JSFiddle – nothing happens when run it.
dunkoh | 7 years ago
Mixed Content: The page at ‘https://jsfiddle.net/larsac07/t0r8qz9p/’ was loaded over HTTPS, but requested an insecure script ‘http://github.highcharts.com/gantt/highcharts-gantt.src.js’. This request has been blocked; the content must be served over HTTPS.
08:41:45.998 fiddle.jshell.net/larsac07/t0r8qz9p/show/:63 Uncaught ReferenceError: Highcharts is not defined
08:41:48.513 fiddle.jshell.net/:1 Mixed Content: The page at ‘https://jsfiddle.net/larsac07/t0r8qz9p/’ was loaded over HTTPS, but requested an insecure script ‘http://github.highcharts.com/gantt/highcharts-gantt.src.js’. This request has been blocked; the content must be served over HTTPS.
08:41:48.514 fiddle.jshell.net/:63 Uncaught ReferenceError: Highcharts is not defined
at fiddle.jshell.net/:63
dunkoh | 7 years ago
changing the loading of the js file to https fixes it.
Lars Cabrera | 7 years ago
Hi, thanks for reporting. The fiddle tried loading content from http://github.highcharts.com, while you entered the site with https. I updated it to use https://github.highcharts.com.
Best regards,
Lars Cabrera
Kevin Fox | 7 years ago
I cannot reverse the X-Axis using:
xAxis: {
reversed: true
},
Lars Cabrera | 7 years ago
Yes, I see what you mean. Thanks for the report! I’ll add the issue to Github. Although that should be a perfectly valid configuration, may I ask why you wish to reverse it? Just curious 🙂
Kevin Fox | 7 years ago
good question. I want to use the gantt chart not for the typical use case but more as a timeline and want the time to go from current to past (left to right)
Lars Cabrera | 7 years ago
I see. That makes sense. Thanks!
FYI: I registered the issue with reversed x-axis as two separate bugs in the repository: https://github.com/highcharts/highcharts/issues/6755 and https://github.com/highcharts/highcharts/issues/6754
cedric reymond | 6 years ago
Hello,
Do you know if it’s possible to display months instead of weeks and days?
currentDateIndicator: true, this paramater does not seems to have any effects…
Lars Cabrera | 6 years ago
Hi, Cedric.
Yes, by setting the tickInterval and label format: https://jsfiddle.net/53ya6yq8/1/.
The currentDateIndicator is simply the red plotLine in the chart displaying the current date.
cedric reymond | 6 years ago
Thanks Lars!
That worked fine.
Is it possible to change the look of the progress % font ?
It looks gloss and does not render very well on IE
Is it possible to add a description to the task , that will be displayed either below the tiltle or on the mouse over? https://uploads.disquscdn.com/images/c101a8afc457f179d32c70594f1d3d39a0233405bfc74b703af5d98a7f0d2186.jpg
Lars Cabrera | 6 years ago
Hi, sorry for the late reply.
Changing looks of % text is done by setting http://api.highcharts.com/highcharts/plotOptions.series.dataLabels.style: https://jsfiddle.net/53ya6yq8/7/
Best regards,
Lars Cabrera
Ali Ahmed | 6 years ago
Hello I need to customize high gantt charts with custom labels for bars and place hyper link for y-labels. Is there a way around?
Ali Ahmed | 6 years ago
Also Is there a way I can only show Months but not weeks?
Ali Ahmed | 6 years ago
Also when I am adding Long Duration in Min and Max values of chart then the UI of chart is breaking why it is not flexible to manage the width of Table according to Date Range?
Øystein | 6 years ago
I’m afraid I don’t understand what you mean by this, do you have a jsFiddle demo of the issue, or similar?
Ali Ahmed | 6 years ago
Hey pardon for not making your clear with my question. My question is that if I provide today date in x-axis min property and put (today + 4 years) in max value and format date with months and years then the X-Axis of month series is appearing too long which is breaking the Chart UI (Not even displaying the values in it). Here is the example https://jsfiddle.net/53ya6yq8/1/. I saw Google Gantt charts in which if there is such situation then it gracefully handles the width of X-axis. Is there any way it just skip middle months and show like (June, July … ) this or something?
Øystein | 6 years ago
I see, we don’t currently support that, but eventually we could try to get support for the Highstock Navigator (https://www.highcharts.com/docs/chart-concepts/navigator) in Gantt as well. I think that would help with cases like this.
Ali Ahmed | 6 years ago
How can we make container larger is there a property?
Øystein | 6 years ago
You can do this just with CSS. There are chart.width and chart.height properties, but we have some bugs there still with Gantt charts. Example: http://jsfiddle.net/p6dodwq9/
Øystein | 6 years ago
With the latest code you can define xAxis as an array with a single object, and this will stop Gantt from automatically creating the second axis. Here is a demo, also showing how to add custom labels to points (with links): http://jsfiddle.net/53ya6yq8/4/
Ali Ahmed | 6 years ago
Thank you for this. Also please tell me that if I can customize few more things such as Tooltip content with HTML, Legend and Bar Colors, Disable Percentage on Bars etc?
Øystein | 6 years ago
You can, see http://api.highcharts.com/highcharts/tooltip.useHTML. The API reference also shows you other options for customizing, including colors. Regarding % on bars, that is set by the data, in the “completed” option. By not including this option, there should be no % label by default. Otherwise, look into dataLabel formats for more control.
Ali Ahmed | 6 years ago
Thank for this API reference. I tried to change options for tooltip very few are working, I can’t override the content, is there a support for this. Also I checked onto series options in the documentation why I couldn’t find one for Gantt chart? There were options for other charts? For example I also need to place html links to the yAxis labels can you tell me how can I do that?
Lars Cabrera | 6 years ago
Hi, Ali. Gantt is still in Alpha, so documentation for its special options are not documented the same place yet. See the Data Format section on this page to see which options are available in addition to standard Highcharts.
It would greatly help if you listed which tooltip options you were struggling with. I cannot see any options not working.
Best regards, Lars Cabrera
Ali Ahmed | 6 years ago
Thanks for response Lars I appreciate that. Well yeah I had to struggled a lot but I figured to manage my chart, Highcharts are awesome by the way. Well there is one last thing I need from you which is that I learnt how to place data labels on bars but on one of my chart’s bar the data label is quite long which unfortunately bar is not able to display that data label however I used crop and overflow options and both seem to be not working with it. Can you help me with this?
Ali Ahmed | 6 years ago
Also when I am using useHTML option on dataLabels then the formatted text overlapping the tooltip. See here http://jsfiddle.net/53ya6yq8/4/. If you hover on “prepare office building” bar then you will see formatted text overlaps tooltip container.
Lars Cabrera | 6 years ago
When you use HTML to render your labels, the labels are generated outside the chart SVG, and therefore cannot be displayed underneath the tooltip, which is rendered in the SVG. But you can work around that with some settings and css: http://jsfiddle.net/53ya6yq8/9/
Lars Cabrera | 6 years ago
If you could share what you have so far, I might be able to help 🙂
Ali Ahmed | 6 years ago
Yes here is the example http://jsfiddle.net/53ya6yq8/4/, See first bar I have placed long text in data tables
Lars Cabrera | 6 years ago
Oh, right, the same example. There’s unfortunately no fix for this, if you really need to have html in the data labels. I would recommend rather moving that to the tooltip. That would fix the problem
Ali Ahmed | 6 years ago
Yeah thanks. I was wondering that since the text is not showing up on the bar because of longer length than the bar so if I could you know place ellipsis for the text so at least some text could be shown instead of hidden text.
Gina J. Harris | 6 years ago
Insurance business out of health care!
Øystein | 6 years ago
Ali, we just fixed a bug with pointFormat, so that should now work. As Lars says, Gantt is still in Alpha so there might be bugs, and the documentation is not released yet. Most generic options are similar to column charts. To allow HTML in yAxis labels, set yAxis.labels.useHTML. Example: http://jsfiddle.net/kaffwgao/
Anup Patil | 6 years ago
Hello,
I have implemented Gantt chart, I would like to know that how to manipulate the tasks and sub-tasks, I mean can we manage the css for them. The parent task arrow and sub tasks are seems at a similar level, how to move sub-tasks to slightly on right (Lets say 10-15px)?
One another point is all the parent tasks expands at the start, I just want let user decide which task to expand.
Does ArrowSymbols module consist these things?
Thanks
Anup
Øystein | 6 years ago
Hi, these features are not implemented yet, but I will add them both to our issue tracker as enhancement suggestions.
Anup Patil | 6 years ago
Hi,
How can I collapse all the tasks on loading, as it is very tough to identify the parent child relationship of tasks and sub tasks.
I have tried editing highchart-gantt.src.js file but not succeed in it.
Thanks in advance
Jon Arild (Highsoft) | 6 years ago
Hi Anup,
If you somehow expose the isCollapse and collapse functions, by editing highcharts-gantt.src.js. Then I believe that you should be able to do the following in the chart load event:
var axis = chart.yAxis[0];
Highcharts.objectEach(axis.treeGridMap, function (node, pos) {
if (!isCollapsed(axis, node, pos)) {
collapse(axis, node, pos);
}
});
While editing the source file, you should also modify the collapse function to pass in a second parameter to axis.update, to allow for optional redrawing of the chart.
In the future this will be a much simpler process, when we get around to formalize, and expose the isCollapse, collapse, and expand functionalities.
Hope this helps.
Best regards
Jon
Amber Blaylock | 6 years ago
Hrm. I have a bit of an odd situation trying to combine this with React – we’d been loading the general “code.highcharts.com” module on the page and then including additional modules for gauges, etc. on an as-needed basis. We have checks against repeated includes that work fine for all the other chart types. We want to do the same thing with this module, but it seems like it’s not compatible to just include both “code.highcharts.com” and “github.highcharts.com/gantt/highcharts-gantt.src.js” on the same page.
Is my only option to replace “code.highcharts.com” with “github.highcharts.com/gantt/highcharts-gantt.src.js” and chug along? I’m not really sure that’s the best solution, given that this is in alpha. Is there any package we can include that works as an add-on with “code.highcharts.com” already included, a la highcharts-more, solid-gauge, etc.?
(Also, is there an equivalent to setOptions for Gantt charts? We have a setup in React where we’re updating the options via setOptions on prop change if the chart already exists rather than removing and rerendering it ad nauseum.)
Øystein | 6 years ago
Hi Amber,
There is a Gantt module file (modules/gantt.src.js) that can be added onto standard core Highcharts (highcharts.js), but since this module relies on changes made to the standard core that have not made it into production yet, you would still have to load the Alpha version of the standard core. Example: https://jsfiddle.net/t0r8qz9p/61/. In other words there are no particular benefits of doing it this way, as you will still be loading the Alpha version.
Loading highcharts-gantt.src.js is the same as including the Alpha version of the standard highcharts.js as well as the Alpha Gantt module. So you are probably best off just replacing your “code.highcharts.com/highcharts.js” references with “github.highcharts.com/gantt/highcharts-gantt.src.js” for now.
Regarding setOptions, you might be looking for “chart.update()”? See http://api.highcharts.com/highcharts/Chart.update. There might be bugs with this in combination with Gantt charts, but feel free to report those on our issue tracker: https://github.com/highslide-software/highcharts.com/issues
Amber B | 6 years ago
Thank you! I’ll take a look at chart.update(). Just for planning purposes on our end, do you know around when those changes to the standard core will be entered into production?
Øystein | 6 years ago
We are aiming for Beta release of Gantt this year, but final release date is not set yet. Possibly late this year or maybe early 2018.
Amber B | 6 years ago
Awesome, thank you!
Amber B | 6 years ago
Hey, me again. Sorry to keep bugging you guys, but I’ve just encountered two errors with this. Both are specific to this version of the core code (but not Gantt-specific; one occurs with all chart types I’ve tried so far and the other was specifically identified with solid gauge coloration).
The first is a very odd error involving an interaction between updating the props of a React component and the accessibility module.
Specifically, the issue appears to occur under the following scenario:
1. Include both “https://github.highcharts.com/gantt/highcharts-gantt.src.js” and “https://code.highcharts.com/modules/accessibility.js”
2. Include a method to destroy and re-create the chart whenever the options props are updated (triggered via componentWillReceiveProps)
3. Update the props to include new options.
The specific received error is:
“Uncaught TypeError: Cannot read property ‘hcEvents’ of undefined
at H.removeEvent (VM5218 highcharts-gantt.src.js:1695)
at H.Chart. (VM5221 accessibility.js:39)
at H.fireEvent (VM5218 highcharts-gantt.src.js:1821)
at H.Chart.destroy (VM5218 highcharts-gantt.src.js:16090)”
I ran into this issue when making a reusable component we have which can display a number of dynamic data options including series pulled from a database, configurable display options, etc.
You can see a JSFiddle reproducing the issue at a fairly minimal level here: http://jsfiddle.net/amber_workxpress/upe3bm3r/23/
In order to reproduce it, first click the “2011-2013” button, then click “2010-2016”. After both buttons have been pressed this issue will occur each time the button is pressed. Since this does not update the options, this bug definitely is a breaking issue.
Please note: using chart.update does resolve the issue, but does not satisfy our use case because the number and names of the series we are using may change between option updates, but using chart.update will leave in old series options after they should have been removed. (You can see an example of this behavior here: http://jsfiddle.net/amber_workxpress/upe3bm3r/24/) My research had shown that the best way to resolve this was to destroy and rebuild the chart if the series options changed; if there’s another workaround that would let us update the series arbitrarily without encountering this issue, I’d definitely be open to using it.
**************
The second issue appears to occur when configuring colors for solid gauges while using this package. Specifically, this happens when setting up a multi-ring gauge chart and using Highcharts.Color in order to give each ring its own color and faded corresponding color track.
The specific error I receive for this is:
”
Uncaught TypeError: c.color.tweenTo is not a function
at H.Axis.toColor (solid-gauge.js:11)
at solid-gauge.js:12
at Array.forEach ()
at H.each (highcharts-gantt.src.js:1608)
at object.drawPoints (solid-gauge.js:12)
at object.render (highcharts-gantt.src.js:18460)
at object.render (highcharts-more.js:34)
at highcharts-gantt.src.js:15918
at Array.forEach ()
at H.each (highcharts-gantt.src.js:1608)
”
You can see a minimal example of this here: http://jsfiddle.net/amber_workxpress/a0j3f8uu/1/
I mention both of these issues here instead of at the Git because they seems to be specific to “https://github.highcharts.com/gantt/highcharts-gantt.src.js”. Replacing it with “https://code.highcharts.com/highcharts.js” appears to resolve both issues – but of course also means no Gantt charts for us, which is difficult when we want to have both a Gantt chart on the page and either the accessibility module enabled or a multi-ring solid gauge chart with Highchart-generated colors. I can also submit these both to the Git issue tracker if you would like.
Again, because that was very long, to summarize, I am receiving two issues: the first “Cannot read property ‘hcEvents’ of undefined” when including the accessibility module alongside the Gantt version of Highcharts core and the second being “c.color.tweenTo is not a function” when using “Highcharts.color” in a solidgauge chart alongside the Gantt version of Highcharts core. Neither error occurs with the core “https://code.highcharts.com/highcharts.js” file.
Renato Garbim | 6 years ago
How can I generate the graph inside a function with input parameters?
Example:
function mountChart(titletext, header, itensSerie, divId) {
Highcharts.ganttChart(divId, {
chart: {
zoomType: ‘x’
},
title: {
text: titletext
},
xAxis: [header],
series: [{
name: ‘Name’,
data: [itensSerie]
}]
});
}
Jon Arild (Highsoft) | 6 years ago
Hi Renato,
Unless I have misunderstood your question, then what you show in your example is more or less one way to do it. Here is a simple live demo: https://jsfiddle.net/t0r8qz9p/85/
I would also recommend you to use our forum (forum.highcharts.com) for technical questions in the future, where you will benefit from a much quicker response rate.
Best regards
Jon
Sandeep Mogaveer | 6 years ago
Hi,
I’m trying to incorporate Gantt Chart on my existing page which already has different Other type of Highcharts.
But when i try to import “highcharts-gantt.src.js”. i’m facing this error https://www.highcharts.com/errors/16.
May b because I’m already included ”highstock.js” already. how to fix this. pls help
Jon Arild (Highsoft) | 6 years ago
Hi Sandeep,
Yes, you are right that the error is caused by
highstock.js
. Since you have already included an instance of Highcharts, it will throw this error when you try to include another instance of Highcharts, thehighcharts-gantt.src.js
.You can avoid this by using
modules/gantt.src.js
instead.Best regards
Jon
Sandeep Mogaveer | 6 years ago
Hi Jon,
It worked. But for Gantt Chart, it is throwing an error like ‘Cannot read property ‘getBBox’ of undefined’. Which can be replicated on JSFiddle example of grantt chart.
https://uploads.disquscdn.com/images/de9cb97dda58f1dab31f6fad95c909d06297e1d4b5461d1f70629cb743009625.png
Thank you for the help.
Jon Arild (Highsoft) | 6 years ago
Hi Sandeep,
This seems to be because
highstock.js
is loaded from the master branch, whilemodules/gantt.src.js
is loaded from the gantt branch.If you load both of them from the gantt branch it should work fine, like in the following example: https://jsfiddle.net/ztu38vw0/1/
You should also be aware that github.highcharts.com is a service for testing, and is therefore not recommended for use in a production environment.
Best regards
Jon
Sandeep Mogaveer | 6 years ago
Thank you so much. Its Working fine now.
Stephane Forrer | 6 years ago
Hi … has this made it’s way out of alpha yet? We’re hoping there’s been an improvement in loading times when you have a large number of days to view (e.g. 365 days/ticks on top horizontal bar).
Thanks
Jon Arild (Highsoft) | 6 years ago
Hi Stephane,
Highcharts Gantt is still in Alpha, but we are aiming to release a Beta during December 2017.
I would also recommend you to post your issue on our GitHub repository, and we will try to fix it as soon as possible.
Best regards
Jon
Sandeep Mogaveer | 6 years ago
Hi there, i’ve 2 cases to discuss.
1. xAxis – min and max values. these seems to be calculating wrong if it is set to Automatic(keeping min and max to default/null).
2. Is it wrong to have similar Task Names under 2 different Parent Tasks? Because it is showing blank for the second time and showing values together in first Parent. Though i’ve ‘id’ different for both Tasks and only task name is same.
To replicate at JSFiddle Highchart Gantt Example..
1. comment min and max. for first case
2. change task name ‘Inspect building’ to ‘Relocate staff’ for second case.
Thanks in Advance 🙂
Jon Arild (Highsoft) | 6 years ago
Hi Sandeep, please contact our technical support at [email protected] and they will assist you.
Best regards
Jon
Sandeep Mogaveer | 6 years ago
Sure Jon. Thank you.
Parth Sabuwala | 6 years ago
Hi Team, I am new to Gantt Highcharts, can i add link for add/edit item in this?
Øystein | 6 years ago
Hi Parth, we do not include editing functionality out of the box at this point. You can however use the dynamic functionalities of Highcharts to build this on top of Highcharts Gantt. See e.g. https://api.highcharts.com/class-reference/Highcharts.Series%23addPoint#addPoint
Beth Stickels | 6 years ago
Hi, can you please advise when the interactive gantt charts will be released? Has it made it’s way out of alpha yet? As a company we are really interested in using this in our code.
Øystein | 6 years ago
Hi Beth, we are still in Alpha, but aiming for a beta release soon (Q1). We’d love for you to try it out and send us any feedback you might have.
Beth Stickels | 6 years ago
Thanks Oystein, we will be delighted to try the beta as soon as it is avaiable.
Amber B | 6 years ago
Hey, quick question regarding exporting – I see that the client-side export functionality with this works fine, but does server-side exporting? I tried using the JSFiddle from the Export Module Overview page in order to export a sample set of Gantt data, but it didn’t work, and I’m not sure if I did it wrong or if it’s not supported. We’d *very* much like to be able to export Gantt data without having to go through the browser, so if there’s any way to do this, we’d really appreciate it. (We’re completely willing to run our own server if that’s what it takes; that’s on the roadmap for sooner or later regardless.)
Ellen J Escarcega | 5 years ago
What’s the status of this?
Romain | 5 years ago
Hi,
i have an issue.
When i try to filter projects on my gantt, some still appear even if i want to hide them.
What i note is that if you have 5 projetcs for exemple and you want to see only the first and the third, the second stay visible.
if you want the first and the last, all still appear.
Am i clear enought?
Is this normal?
Any help to resolve my problem?
Liam | 5 years ago
I’d love to know what the timeline for gantt chart release is.
Is there a set timeline?
Want to leave a comment?
Comments are moderated. They will publish only if they add to the discussion in a constructive way. Please be polite.