additional product
Highcharts® Gantt
Going places no other JavaScript has gantt before. A robust JavaScript library that makes it easy for developers to build interactive charts for allocating, coordinating, and displaying tasks, events, and resources along a timeline. Check out our Highcharts Gantt demos.
Popular Highcharts Gantt Demos
Highcharts Features

Helpful Standard Features
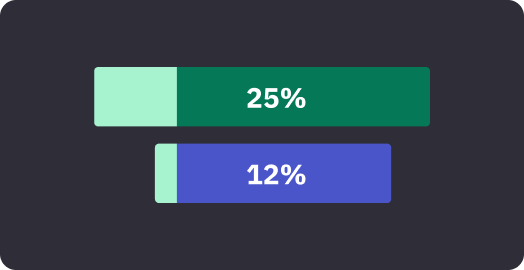
Highcharts Gantt includes many advanced and useful features by default, such as Milestones, Percent-complete shadings, Current day indication, and Relationships between activities.


Multi-format Exports
Export Highcharts Gantt charts into multiple raster or vector graphics formats. Perfect for including the charts in static reports and presentations.

Interactive
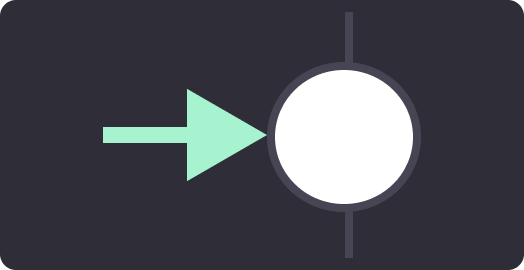
Drag and drop objects to change their duration and order. The API also allows user-manipulation of the GUI to be written back to the server.


Developed with Clients
Highcharts Gantt was developed and quality-controlled in close dialogue with clients who were unable to find existing market solutions that met their needs.

Versatile Use Cases
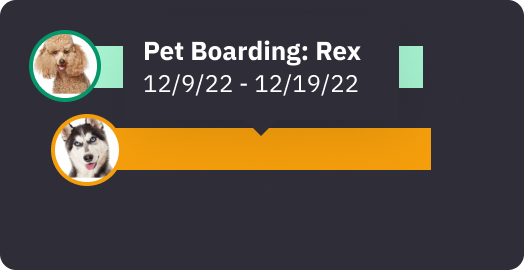
Gantt charts are great for any kind of asset allocation or scheduling, from reserving meeting rooms at work to keeping track of the kids’ after-school activities.

Includes Highcharts Core
The Highcharts Core library is also included, which provides an additional 30 different chart types.
Gantt Axis Grid
The grid axis makes it easy to display task information in table form.
Dependencies Between Tasks
Configure dependencies between tasks to visualize the work breakdown structure of a project.

Main Highcharts Features
Join Our Vibrant Community
The most significant developer community of any premium charting tool on GitHub, StackOverflow and Highcharts’ Forums, is eager to offer additional assistance, platform-specific implementation advice and inspiration when you need it.
Check out our documentation
Our customers praise our documentation as easy to follow, extensive and well organized. Filled with helpful examples, our API reference will have you customizing your data visualizations in no time and make maintaining them a breeze.


