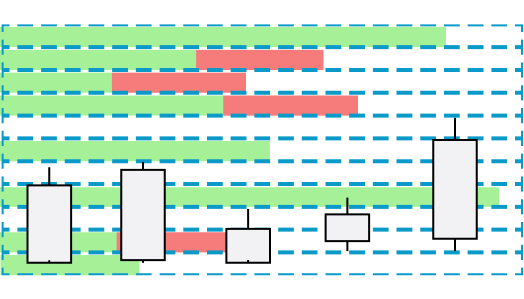
MorningstarMorningstar

Connect To Morningstar

New

Use Morningstar data in stock charts

additional product

Highcharts® Stock

Create stock or general timeline charts for your web and mobile apps. Features sophisticated navigation for high-volume data, user annotations and over 40 built-in Technical Indicators. Based on Highcharts, the leading, battle-tested SVG-based charting tool, and leader in accessible charts.
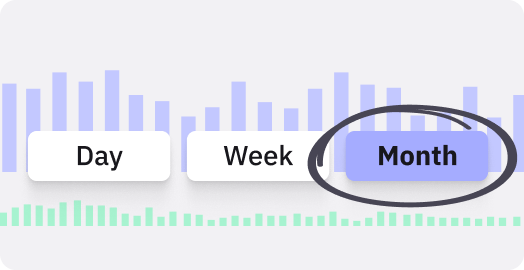
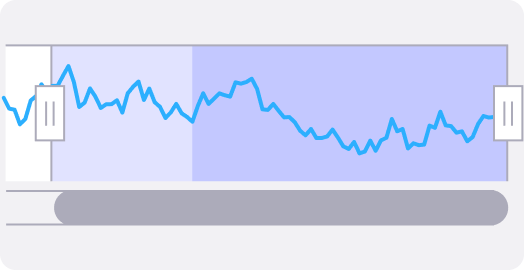
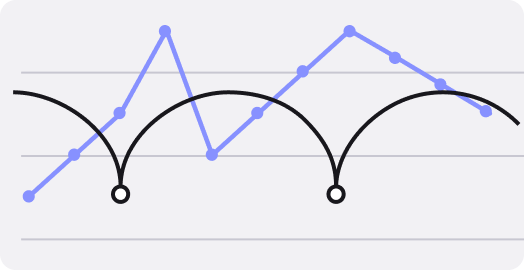
Highcharts Stock Features

New

Supercharge your Stock Charts with Morningstar Data

Integrate Morningstar’s trusted data with Highcharts using our pre-built data connector. No development headaches or security concerns. Just connect and go.

40+ Tech indicators

Including SMA, MACD, CCI, RSI, Stochastic, Bollinger Bands, Pivot Points, PSAR, and Ichimoku Kinko Hyo. Check out the demo.

Data Grouping

Group data into optional groups like days, weeks and months with Highcharts Stocks’ blazingly-fast data grouping feature.

Navigation for Finance

Includes small navigator series, preset date ranges, date picker, adjustable panes, scrolling and panning.

Secure

Use Highcharts Stock on your intranet or password protected websites without worrying about anyone siphoning your data.

Stock Tools

Analysts and end-users can annotate and apply statistical calculations on any data-set without the aid of developers.

Includes Highcharts Core

The Highcharts Core library is also included, which provides an additional 30 different chart types.

Pivot Points

Visualize the momentum and trend of your data with pivot point indicators.

Cumulative Sum

The Cumulative Sum tool sums all the previous values with the current value in a visible range.

Main Highcharts Features

Works with your stack

All our charting libraries work with any back-end database or server stack. Provide data in any form, including CSVJSON, or load and update it liveIntegration with popular languages, such as .Net, PHP, Python, R, and Java, as well as iOS, and Android, and frameworks like Svelte, Angular, Vue and React, are available from Highcharts or our community.

TypeScript

Thanks to the native integration of TypeScript declarations, the Highcharts NPM package allows type checking for most options and functions, including auto-complete code with integrated documentation for TypeScript-capable editors like Visual Studio Code.

Dynamic and Customizable

Our elegant charts render crisp and clear at any resolution and are easily styled via our simple options-structure using JavaScript or CSS. Highcharts is also extendable and pluggable for experts seeking advanced animations and functionality. Check out some advanced cool use cases in our community section, and plugins in our extensions directory.

Responsive

Intelligent responsiveness not only adjusts the chart to the dimensions of its container but also automatically places non-graph elements such as labels, legends, and headings in the most optimal location.

Multi-Touch Gesture Support

Multi-touch gesture support allows for a native experience on mobile and touch screens. Touch gestures include single touch-drag for data inspection, multi-touch for zooming, and more.

Annotations

Draw simple shapes and text anywhere on the canvas to describe charts or tether them to specific data points. The annotation module also includes an API to configure toolbars and dialogues for end-users to place their annotations on a chart. Placement and visibility of annotations intelligently respond to canvas/screen size at run-time.

Accessibility and Sonification

Highcharts offers an accessible interactive chart solution to empower people with disabilities. Each Highcharts license includes our Accessibility module and a flexible sonification API. The Accessibility module allows you to create charts as accessible as possible, whereas the sonification API helps you support multiple ways to bring data to life with sound. Visit our Accessibility Portal for more information.

Data Processing in the Browser

With Highcharts, source data can be post-processed in the client to improve the user experience. An excellent data processing feature is the ability to sort data, regardless of whether the data source is sorted.

Big-Data Ready

When you need to render thousands or millions of data points in the browser, our WebGL-powered boost module delivers incredible speed.

Export & Print

With the export module enabled, your users can export the chart to PNG, JPG, PDF or SVG format at the click of a button, or print the chart directly from the web page.

Debugger

The Highcharts Debugger will help you speed up development by providing instantaneous warnings and error reports above your charts. The error messages provide clear instructions on how to resolve your issue.

Source Available

Download the source code, inspect it, and make your edits as you wish. A trial license is not required to try the code. When you are ready to use the software for commercial projects, the appropriate license must be in place. Please see our shop for more information.

Join Our Vibrant Community

The most significant developer community of any premium charting tool on GitHubStackOverflow and Highcharts’ Forums, is eager to offer additional assistance, platform-specific implementation advice and inspiration when you need it.

Check out our documentation

Our customers praise our documentation as easy to follow, extensive and well organized. Filled with helpful examples, our API reference will have you customizing your data visualizations in no time and make maintaining them a breeze.

Robustify Highcharts