
additional product
Highcharts® Stock
Create stock or general timeline charts for your web and mobile apps. Features sophisticated navigation for high-volume data, user annotations and over 40 built-in Technical Indicators. Based on Highcharts, the leading, battle-tested SVG-based charting tool, and leader in accessible charts.
Popular Highcharts Stock Demos
Highcharts Stock Features

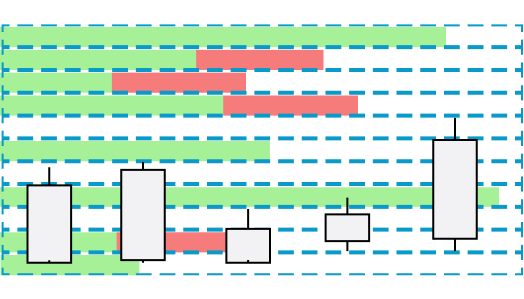
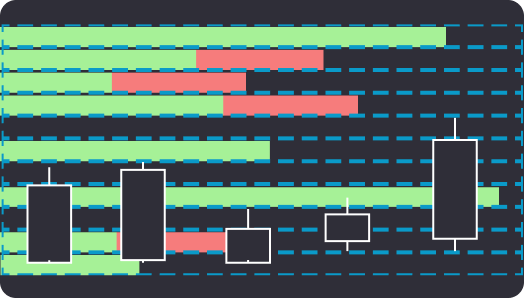
40+ Tech indicators
Including SMA, MACD, CCI, RSI, Stochastic, Bollinger Bands, Pivot Points, PSAR, and Ichimoku Kinko Hyo. Check out the demo.
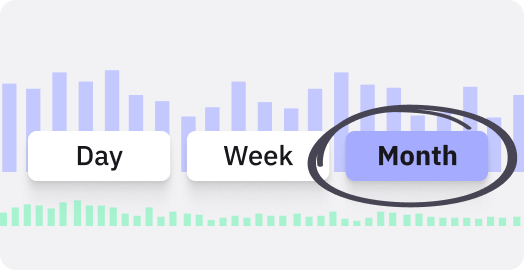
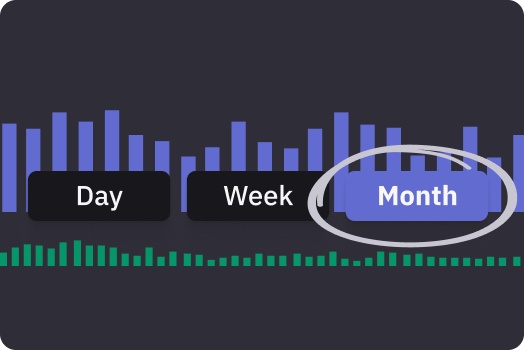
Data Grouping
Group data into optional groups like days, weeks and months with Highcharts Stocks’ blazingly-fast data grouping feature.
Navigation for Finance
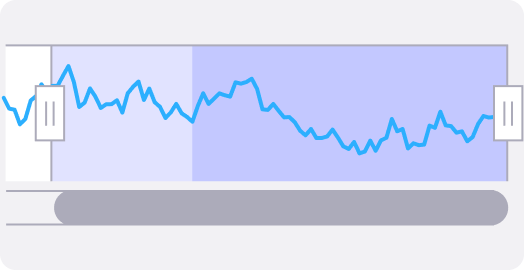
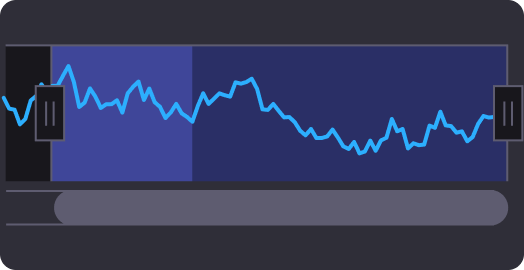
Includes small navigator series, preset date ranges, date picker, adjustable panes, scrolling and panning.


Secure
Use Highcharts Stock on your intranet or password protected websites without worrying about anyone siphoning your data.
Stock Tools
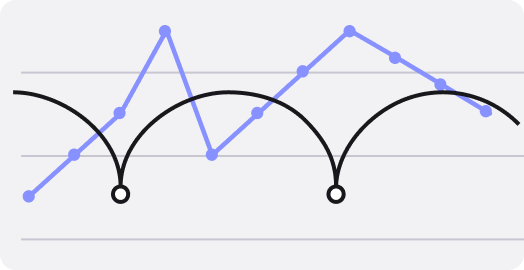
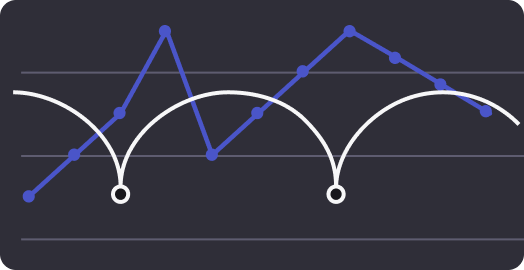
Analysts and end-users can annotate and apply statistical calculations on any data-set without the aid of developers.

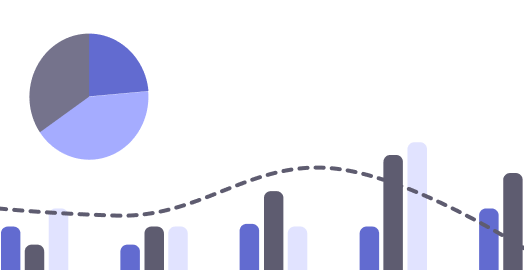
Includes Highcharts Core
The Highcharts Core library is also included, which provides an additional 30 different chart types.
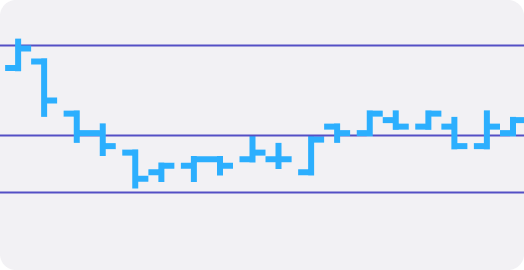
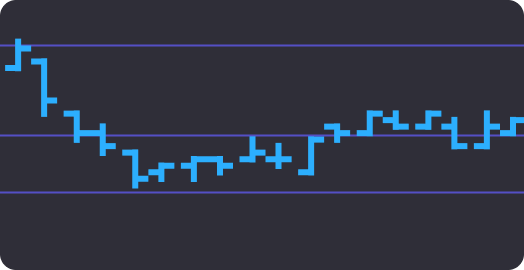
Pivot Points
Visualize the momentum and trend of your data with pivot point indicators.
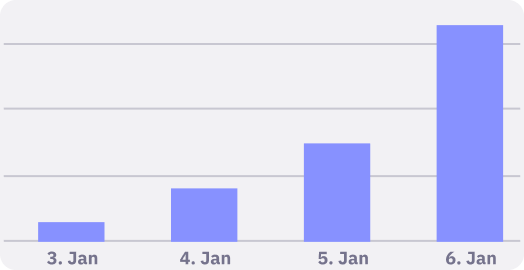
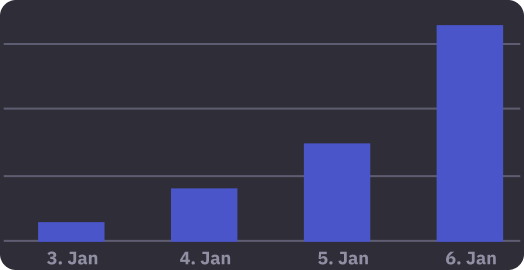
Cumulative Sum
The Cumulative Sum tool sums all the previous values with the current value in a visible range.

Main Highcharts Features
Join Our Vibrant Community
The most significant developer community of any premium charting tool on GitHub, StackOverflow and Highcharts’ Forums, is eager to offer additional assistance, platform-specific implementation advice and inspiration when you need it.
Check out our documentation
Our customers praise our documentation as easy to follow, extensive and well organized. Filled with helpful examples, our API reference will have you customizing your data visualizations in no time and make maintaining them a breeze.