Farmable, an agricultural data platform, faced exactly that. As the platform scaled, three main problems became impossible to ignore:
- Load times increased across the web portal
- Mobile and web fell out of sync
- The codebase became too costly to maintain and extend
This post walks through how Farmable addressed these problems through a real-world architecture transformation, and what role Highcharts played in that process. It is written by Black Label, a team of data visualization experts who have been part of the Highcharts core development team since 2010.
Farmable: an AgTech platform built around structured farm data
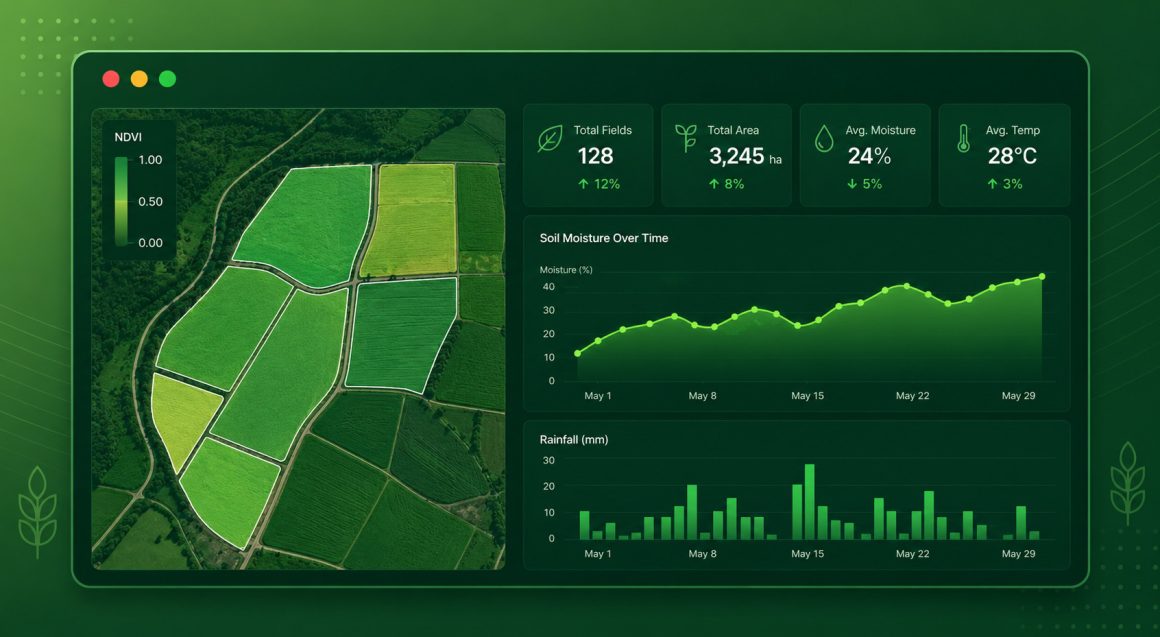
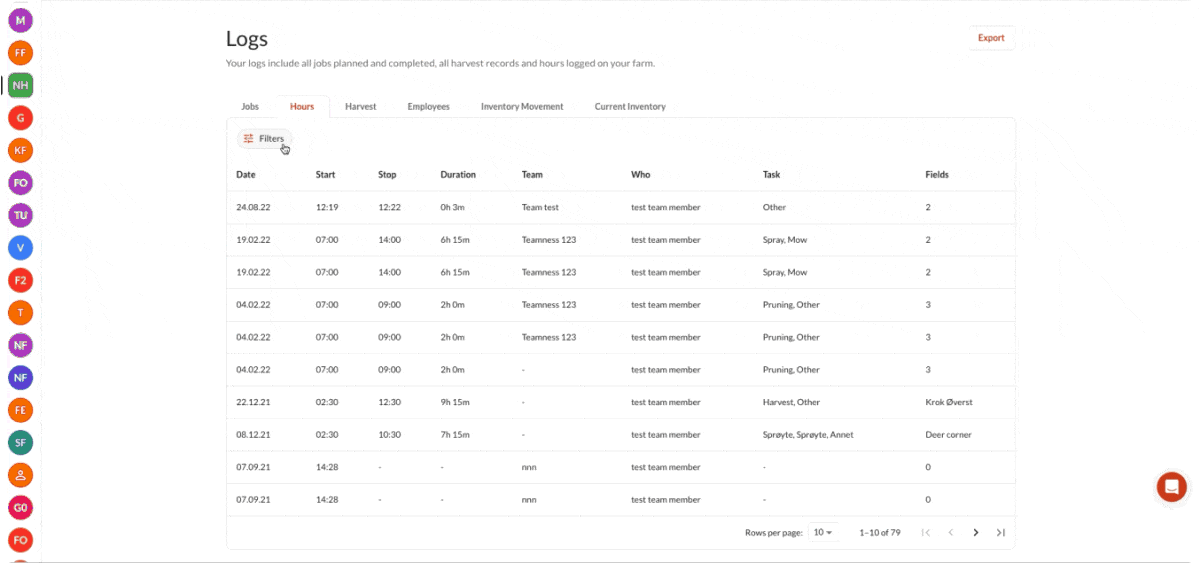
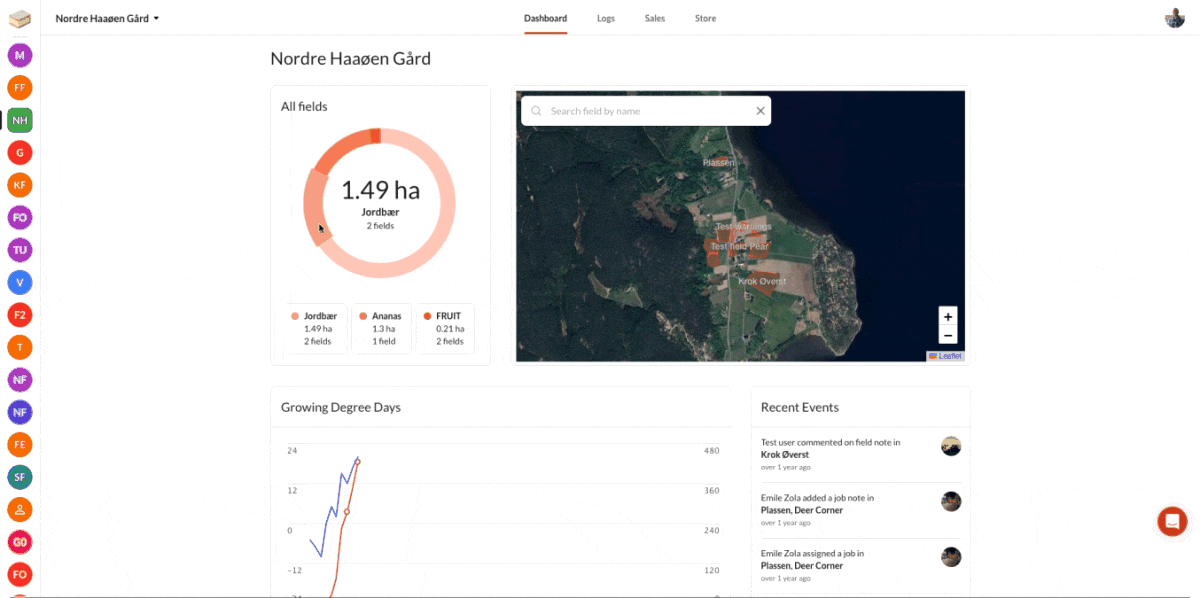
Farmable is an AgTech platform founded in Scandinavia, built to transform how farmers collect, organize, and use data. The platform operates as an ecosystem of applications. Farmers record field activities in a mobile app, mapping fields and logging crops, fertilizers, pesticides, and harvests. That data flows into a web portal, where it is structured into reports required for audits and certification.
The web portal is not a typical interactive application. Its primary function is to give users structured access to their field data.
When frontend architecture becomes the bottleneck
As Farmable grew, the web portal’s architecture struggled to keep up. The web portal, backed by a shared backend with the mobile app, served as a data access and reporting layer in practice, but its architecture was not originally structured around that role. As the user base expanded and data volumes increased, several problems emerged:
- State management overhead: the portal relied on Redux, a powerful tool that proved overly complex for the need of a reporting-focused single-page application
- Maintainability: the codebase became difficult and costly to extend
- Synchronization: data consistency between the mobile app and the web portal caused numerous issues
- Performance: load times increased and system overloads caused delays in accessing data
The root cause was not the data model or the backend. The frontend had grown misaligned with what the system was actually doing.
Restructuring Farmable’s web architecture for scale
To address these issues, Farmable partnered with Black Label, a team of data visualization experts who have been part of the Highcharts core development team since 2010. Rather than applying incremental fixes, the team restructured the React-based frontend to better support its role as a reporting and data access layer within a shared mobile–web ecosystem.
The key changes focused on three areas:
- State management: Redux was replaced with a leaner solution, reducing unnecessary complexity in a single-page application
- Data synchronization: communication between the mobile app and the shared backend was reworked to ensure data consistency across the ecosystem
- Code structure: the codebase was refactored into a modular architecture, making it easier to maintain and extend
With the architecture redesigned around data flow rather than user interaction, the visualization layer became a structural rather than cosmetic decision. Highcharts was integrated directly into the React-based web portal as the visualization layer, and it was treated as a system component, not a UI feature.
Its native React integration helped keep the visualization layer consistent with the overall frontend architecture. The straightforward configuration structure and flexibility in handling data in various formats allowed the team to implement and adjust dashboards quickly. When the standard configuration wasn’t enough, Highcharts’ extensibility with custom code made it possible to adapt the visualization layer precisely to the platform’s reporting requirements.
From bottleneck to production-scale platform
The architectural redesign addressed the structural limitations that had constrained the platform’s growth. Rather than fixing isolated performance issues, the changes improved how the frontend supported reporting, synchronization, and long-term maintainability.
The results were concrete:
- Performance: load times improved, and the system handled increasing data volumes without overloads
- Reliability: synchronization between the mobile app and the web portal became consistent and predictable
- Maintainability: the refactored codebase was more modular, reducing the cost and complexity of future development
By embedding Highcharts as the visualization layer within the React architecture, the team avoided unnecessary custom development. Visualization remained aligned with the system’s reporting role rather than evolving into an isolated UI concern.
Why architecture alignment matters in data platforms
Farmable’s case illustrates a pattern that appears across many data-heavy platforms: scalability problems often stem not from the data layer, but from a frontend architecture that was never designed to handle the presentation of structured data at scale.
Systems built around data access and reporting shouldn’t be architected like interactive applications. And the visualization layer, often treated as a UI afterthought, needs to be embedded as a system component during architecture design, not bolted on later.
Choosing Highcharts as the visualization layer was part of that architectural decision. It allowed the team to deliver quickly without compromising on stability or maintainability. The result was not a proof of concept, but a production system handling real data from real farm operations, ready to grow with the platform.


Leave a Reply