
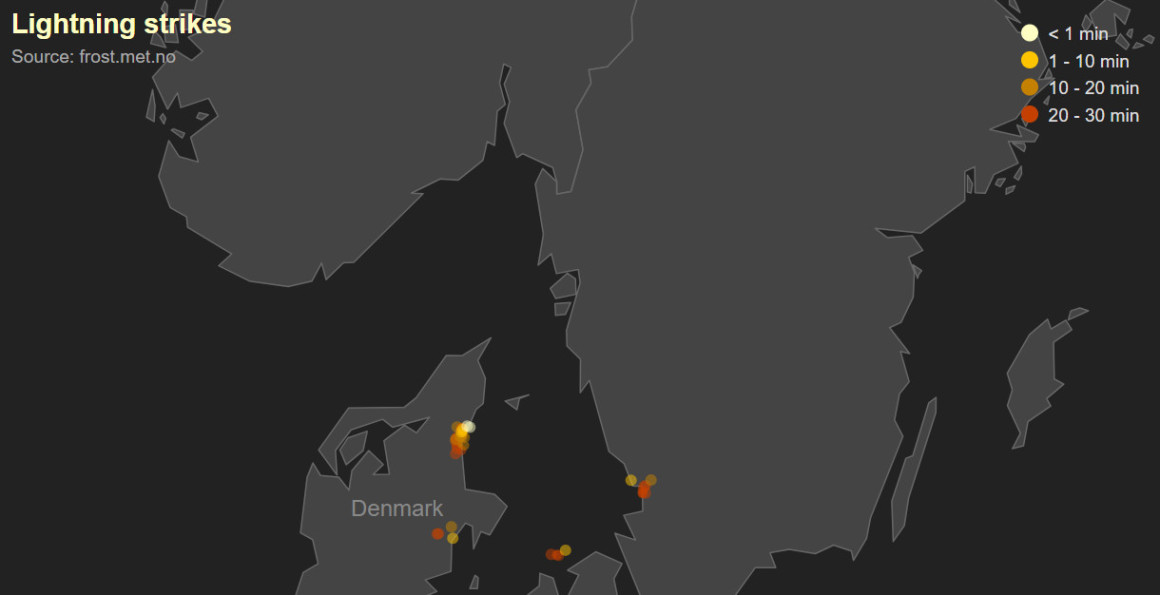
Lightning strikes about 100 times per second worldwide, and static maps cannot capture data that changes this fast. An interactive lightning map shows where and when strikes happen, with each strike colored by its age and a timeline you can play, pause and scrub through. This tutorial recreates the official Highcharts® Maps demo using historical strike data from frost.met.no.
With Highcharts for React, developers get first-class charting with hooks, TypeScript support, and optimized rendering out of the box. Highcharts also integrates with Angular, Vue, and Svelte, as well as server-side languages like Python, R, PHP, and Java, and mobile platforms including iOS and Android.
To explore Highcharts further, visit the interactive demo gallery to see real-world examples, or consult the comprehensive documentation. You can also review the full API reference or learn more about Highcharts products and features.
Why use Highcharts® Maps for a lightning map?
- Real-time data integration for up-to-the-minute lightning strike information: Highcharts® Maps excels in integrating real-time data, a crucial feature for creating a lightning map. With the ability to update data dynamically, users can track lightning strikes as they happen, providing a near-instantaneous view of storm activity.
- Interactive elements like zooming, panning, and tooltips for enhanced user experience: Highcharts® Maps offers a range of interactive features that enhance the user experience. Zooming and panning allow users to focus on specific regions, while tooltips provide additional information when hovering over data points. These features make it easier to interpret complex data and draw actionable insights.
- Customizable design to suit specific project needs: Highcharts® Maps is highly customizable, allowing developers to tailor the appearance and functionality of their maps to meet specific project requirements. From adjusting color schemes to adding custom markers, the possibilities are extensive, enabling a seamless integration into any application or website.
Interactive lightning map example
How do I recreate the lightning map with Highcharts Maps?
Please note that this example uses historical lightning strike data from frost.met.no. However, the same approach can be applied to create a real-time lightning strike map using similar techniques. To learn more on how you can customize your own lightning map with live data, map navigation and more, visit the documentation here.
For basics, see Highcharts installation. The framework requirements and installation is the same for Highcharts® Maps as for Highcharts. To load Highcharts® Maps as a standalone product (if you don’t have a license for Highcharts), include this script tag:
<script src="https://code.highcharts.com/maps/highmaps.js"></script>
If you already have Highcharts installed in the web page and want to run Highcharts® Maps as a plugin, include this script tag after highcharts.js:
<script src="https://code.highcharts.com/maps/modules/map.js"></script>
Create a container for the chart and some controls
<figure class="highcharts-figure">
    <div id="container"></div>

    <div id="controls">
        <input id="date-range" type="range">
        <button id="play-pause">▶︎</button>
        <span id="report-time"></span>
    </div>

    <p class="highcharts-description">
        This is an advanced demo showing how to use a dynamic mapbubble series
        on top of a map, with extended graphic effects to highlight changes in
        the data.
    </p>
</figure>

* <!-- Data from https://frost.met.no/api.html#!/lightning/getLightning -->
* Go to the demo page for “Lightning Map” to view its code and get all the lightning data
Add some CSS to control the size and style of your container and other elements
.highcharts-figure {
    margin: 0 auto;
    min-width: 360px;
    max-width: 800px;
    padding: 0 10px;
}

#container {
    margin: 0 -10px;
}

#controls {
    margin-bottom: 1em;
}

#date-range {
    margin-top: 1rem;
    width: 100%;
}

#play-pause {
    width: 3rem;
    height: 3rem;
    border-radius: 1.5rem;
    background-color: #1767ce;
    color: white;
    border-width: 0;
    text-align: center;
    font-size: 1rem;
    transition: background-color 250ms;
}

#play-pause:hover {
    background-color: #68a9ff;
    color: white;
}

#report-time {
    float: right;
    margin-top: 0.8rem;
}

.loading {
    margin-top: 10em;
    text-align: center;
    color: gray;
}

#data {
    display: none;
}
Load and initialize the lightning map
// Start at this time
let currentTime = Date.UTC(2022, 6, 3, 20);

// Get the data class of a lightning strike based on the time ago
const getDataClass = (now, datetime) => {
    if (now - datetime > 20 * 60000) {
        return 3;
    }
    if (now - datetime > 10 * 60000) {
        return 2;
    }
    if (now - datetime > 60000) {
        return 1;
    }
    return 0;
};

// Parse the data which comes in the ualf format, a subset of CSV
const parseData = () => {
    const ualf = document.getElementById('data').innerText,
        lines = ualf.split('\n');

    const data = lines
        .map(line => {
            const values = line.split(' ');

            const p = {
                lon: parseFloat(values[9]),
                lat: parseFloat(values[8]),
                datetime: Date.UTC(
                    values[1],
                    parseInt(values[2], 10) - 1,
                    values[3],
                    values[4],
                    values[5],
                    values[6]
                ),
                peakCurrent: parseFloat(values[10]),
                cloudIndicator: Boolean(+values[21]),
                z: Math.round(parseFloat(values[10])),
                colorValue: 0
            };

            return p.cloudIndicator ? undefined : p;
        })
        .filter(p => p !== undefined)
        .sort((a, b) => a.datetime - b.datetime);

    return data;
};

const ualf = parseData();

// Get the data for the initial time
const getInitialData = time => ualf.slice(
    ualf.findIndex(p => p.datetime > time - 30 * 60000),
    ualf.findLastIndex(p => p.datetime <= time)
).map(p => {
    p.colorValue = getDataClass(time, p.datetime);
    return p;
});

const displayTime = time => {
    document.getElementById('report-time').innerText = Highcharts.dateFormat(
        '%B %e, %Y %H:%M',
        time
    );
};

(async () => {

    // Load the map
    const topology = await fetch(
        'https://code.highcharts.com/mapdata/custom/europe.topo.json'
    ).then(response => response.json());

    // Create the chart
    const chart = Highcharts.mapChart('container', {
        chart: {
            map: topology,
            height: '80%',
            margin: 0,
            backgroundColor: '#222',
            animation: false
        },

        accessibility: {
            enabled: false
        },

        title: {
            text: 'Lightning strikes',
            align: 'left',
            style: {
                color: 'rgba(255,255,196,1)'
            }
        },

        subtitle: {
            text: 'Source: <a href="https://frost.met.no/api.html#!/lightning/getLightning" style="color: inherit">frost.met.no</a>',
            align: 'left',
            style: {
                color: '#aaa'
            }
        },

        legend: {
            align: 'right',
            verticalAlign: 'top',
            layout: 'vertical',
            itemStyle: {
                color: '#ddd'
            }
        },

        mapView: {
            center: [12, 56.8],
            zoom: 7,
            projection: {
                rotation: [-15]
            }
        },

        colorAxis: {
            dataClasses: [{
                from: 0,
                to: 0,
                color: 'rgba(255,255,196,1)',
                name: '< 1 min'
            }, {
                from: 1,
                to: 1,
                color: 'rgba(255,196,0,1)',
                name: '1 - 10 min'
            }, {
                from: 2,
                to: 2,
                color: 'rgba(196,128,0,1)',
                name: '10 - 20 min'
            }, {
                from: 3,
                to: 3,
                color: 'rgba(196,64,0,1)',
                name: '20 - 30 min'
            }]
        },

        series: [{
            name: 'Map',
            nullColor: '#444',
            borderColor: '#666',
            dataLabels: {
                enabled: true,
                nullFormat: '{point.name}',
                style: {
                    color: '#888',
                    textOutline: 'none',
                    fontSize: '16px',
                    fontWeight: 'normal'
                }
            }
        }, {
            name: 'Lightning strike',
            id: 'lightnings',
            type: 'mapbubble',
            animation: false,
            data: getInitialData(currentTime),
            tooltip: {
                pointFormat: '{point.datetime:%Y-%m-%d %H:%M:%S}'
            },
            minSize: 4,
            maxSize: 8,
            marker: {
                lineWidth: 0,
                radius: 3
            },
            colorKey: 'colorValue'
        }]
    });
    displayTime(currentTime);

    // Update the colors of the data points
    const updateColors = time => {
        let redraw = false;
        // Modify older points
        chart.get('lightnings').points.forEach(p => {
            let colorValue;
            if (time - p.options.datetime > 30 * 60000) {
                p.remove();
            } else  {
                colorValue = getDataClass(time, p.options.datetime);
            }

            if (colorValue && colorValue !== p.options.colorValue) {
                p.update({ colorValue }, false);
                redraw = true;
            }
        });
        return redraw;
    };

    // For the strongest lightning strikes, light up the chart with a temporary
    // flash
    const flash = point => {
        const pos = chart.mapView.lonLatToPixels(point);

        chart.renderer.circle(pos.x, pos.y, point.z * 2)
            .attr({
                fill: {
                    radialGradient: { cx: 0.5, cy: 0.5, r: 0.5 },
                    stops: [
                        [0, 'rgba(255, 255, 0, 0.25)'],
                        [0.1, 'rgba(255, 255, 0, 0.125)'],
                        [1, 'rgba(255, 255, 0, 0)']
                    ]
                },
                zIndex: 10
            })
            .add()
            .animate(
                { opacity: 0 },
                { duration: 250 },
                function () {
                    this.destroy();
                }
            );
    };

    if (updateColors(currentTime)) {
        chart.redraw();
    }

    // The remainder of the data after currentTime
    let data = ualf.slice(ualf.findIndex(p => p.datetime > currentTime));

    const endTime = data.at(-1).datetime,
        step = 10000,
        series = chart.get('lightnings');

    let timer;

    const pause = () => {
        clearTimeout(timer);
        document.getElementById('play-pause').textContent = '▶︎';
    };

    // Add the lightning strikes for the last n minutes
    const addPoints = time => {

        const rangeInput = document.getElementById('date-range');

        // Internal Highcharts CI sample verification
        if (!rangeInput) {
            return;
        }

        currentTime = time;
        let redraw = false;

        displayTime(time);
        rangeInput.value = time;

        if (updateColors(time)) {
            redraw = true;
        }

        // Add new points
        const points = [];
        while (data[0] && data[0].datetime <= time) {
            points.push(data.shift());
        }
        points.forEach(point => {

            redraw = true;

            series.addPoint(point, false);

            if (point.z > 10) {
                flash(point);
            }
        });

        if (redraw) {
            chart.redraw();
        }

        if (time + step <= endTime) {
            timer = setTimeout(() => addPoints(time + step), 25);
        } else {
            pause();
        }

    };

    const play = () => {
        document.getElementById('play-pause').textContent = '▮▮';
        data = ualf.slice(ualf.findIndex(p => p.datetime > currentTime));
        timer = setTimeout(() => addPoints(currentTime + step), 25);
    };

    const setUpInputs = () => {
        // Range input
        const input = document.getElementById('date-range');
        input.min = ualf[0].datetime;
        input.max = ualf.at(-1).datetime;
        input.value = currentTime;

        input.addEventListener('input', () => {
            pause();
            currentTime = Number(input.value);
            chart.series[1].setData(getInitialData(input.value));
            displayTime(currentTime);
        });

        // Play/pause
        document.getElementById('play-pause').addEventListener(
            'click',
            function () {
                if (this.textContent === '▶︎') {
                    play();
                } else {
                    pause();
                }
            }
        );
    };
    setUpInputs();
    // eslint-disable-next-line no-underscore-dangle
    if (!window.__karma__) { // CI tests
        // Wait a bit for Visual review tool
        setTimeout(() => play(), 100);
    }

})();
Conclusion
Creating an interactive lightning map using Highcharts® Maps offers a powerful way to visualize weather data. From setting up the map and integrating data to customizing the visualization and optimizing performance, Highcharts® Maps provides all the tools you need to develop a detailed and responsive map.
Ready to take your weather data visualization to the next level? Get started with Highcharts® Maps today and see how easy it is to create dynamic, interactive lightning maps that can transform your projects.
Frequently asked questions
Which Highcharts product do I need to build a lightning map?
Highcharts Maps. Load highmaps.js as a standalone product, or add modules/map.js after highcharts.js if Highcharts is already on the page.
Which series type shows the lightning strikes?
A mapbubble series placed on top of a base map series. In the demo it is configured with minSize 4, maxSize 8 and colorKey ‘colorValue’.
How are lightning strikes color-coded?
A colorAxis with four data classes colors each strike by age: under 1 minute, 1 – 10 minutes, 10 – 20 minutes and 20 – 30 minutes. Strikes older than 30 minutes are removed from the map.
Where does the lightning data come from?
The demo uses historical lightning data in the UALF format from frost.met.no, starting at 3 July 2022, 20:00 UTC. The same approach can be applied to live data.
How does the play/pause and time slider work?
A range input sets the current time and a play/pause button starts or stops a timer. The timer adds new strikes in 10-second steps with series.addPoint, and the strongest strikes trigger a short flash drawn with the renderer.
Resources
- Documentation – Getting started with Highcharts® Maps
- Highcharts® Maps API Reference
- Different maps in the demo/example section
- Basic tutorial – Using Highcharts® Maps® for Python
- Highcharts® Maps for Python
- Small multiples map with Highcharts and React
Related posts
- Choropleth map examples using Highcharts
- Maps with latitude & longitude using Highcharts
- Heat map examples using Highcharts
- Visualizing geospatial data with Highcharts Maps
- Polygon chart using Highcharts
- JavaScript library by Highcharts









Leave a Reply