
Infographics, when done right, break out of the box of a “standard” chart to tell a data-story in a more visually engaging way.
Ironically, in this day and age, most infographics are static images. But, if you want to engage an online audience, why not use an interactive infographic?
In this tutorial, I will show you how to build an interactive infographic with Highcharts. The subject of this infographic is a comparison of Copa America and UEFA Euro 2016.; the numbers adapted from a “standard,” static infographic found here.
Feel free to check the live version.

Our interactive infographic is a single page application (SPA). I built it without using any framework so that the code would be easy to deconstruct.
Remark
Basic knowledge of Javascript, Node.js, expressJS, and MongoDB is highly recommended to understand the application code.
I’ll walk through the architecture first; then I will explain the code.
The architecture
Basically, the project is to combine a static and dynamic data set in order to create a more engaging infographic. The data are:
- The key numbers of Copa America & Euro 2016.
- The result of a live quiz.
The key numbers are stored within the project files, whereas the quiz results are saved into a database (MongoDB) then read via a server to be visualized.

Let’s examine each part of the architecture.
Database
The quiz results are saved in MongoDB. There are two quizzes in this application:
- The first quiz is about the host for the 2016 Copa America and Euro 2016.
- The second quiz is about the most valuable player in each event.
Remark
MongoDB is easy to use when building JavaScript apps, as it stores JSON natively. You are, of course, free to use any other database or service that suits you.
Here is the structure of the data saved in the database:
1.First quiz
{
    "name": "hostPolls",
    "answers": [
        96,
        44,
        49,
        49
    ]
}
2.Second quiz
{
    "name": "playerPolls",
    "answers": [
        32,
        9,
        2,
        27,
        6,
        9
    ]
}
User interface
The user interface is pretty simple and straightforward; it has 13 pages (or screens, as it is a single page application). Each page displays either:
- One main key number about both events.

- A quiz.

- The result of a quiz.

All the pages have two buttons to go to the next or previous page.
The pages are under this folder src/pages:
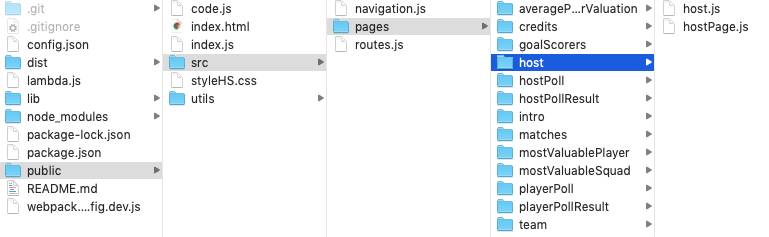
To better organize the pages and to make the maintenance in the future easier, each page has its own folder, where one file has the data and the content of the visualization, and the other file has the HTML code.
For example, the host page folder has the following files:
host.jshas both event’s maps where all the tournaments accrued.hostPage.jshas the HTML code to render the page.
I use jQuery to perform an Ajax request to the server. Nevertheless, any other library or framework will work fine as well. The files related to managing the requests are under the folder utils.
There are two requests postPoll and getPoll:
import ajax from './ajax.js';
export function postPoll(route, answers) {
  return ajax('POST', route, JSON.stringify(answers));
}
export function getPoll(route) {
  return ajax('GET', route);
}
The ajax method is in the ajax.js file:
$.ajax({
      type: type,
      url: url + route,
      dataType: 'json',
      data: data,
      contentType: 'application/json',
      success: function(result) {
        resolve(result);
      },
      error: function(error) {
        reject(error);
      }
    });
Server
The main tasks of the server are to save the quiz data and to retrieve them from the database.
I built the server using Node.js, with the following modules :
- Express to create the local server.
- Request to communicate with the user interface.
- Mongoose to manage the mongo database.
- Config-js to store logins and passwords of the database.
- Cors to avoid cross-origin policy issues, to learn more about the policy, click here.
- Path to deal with file paths in a portable way (note that this module is a part of node itself).
- Clear to launch the clear screen command before each session.
- AWS Serverless Express to run the serverless application on top of AWS lambda and Amazon API Gateway.
Remark
Be sure to protect your credentials by using a config.json file
{
    "dbCredentials":{
        "DBlogin" : "myLogin",
        "DBpwd" : "letMeIn"
    },
    "BLink" : "myLinkTo/infographic"
}
The server offers four routes:
postHostDatato save the host quiz answers into the database.getHostDatato read the host quiz result from the database.postPlayerDatato save the player quiz answers into the database.getPlayerDatato read the player quiz result from the database.
Once all the components of the application are created, all you have to do is to find a web service to host the application. I use the online cloud web service AmazonAWS, but any other service can do the job. Notice the file lambda.js to run the application on AWS lambda.
The code of this file is very basic:
const awsServerlessExpress = require('aws-serverless-express');
const app = require('./lib/app');
const server = awsServerlessExpress.createServer(app);
exports.handler = (event, context) => {
  return awsServerlessExpress.proxy(server, event, context);
};
Well, that’s it, it is that easy. Now you know how to build a responsive interactive infographic with the library Highcharts, and all that without a framework.
Feel free to share your experience with infographics and Highcharts, and let me know if you have any questions or remarks using the comments section below.


Leave a Reply