
The following article summarises how to use Highcharts iOS library in Swift.
We are going to visualize statistical data on the four top Champions League teams of the 2016/2017 season.
A. How to create a Highcharts project
1. Getting started
- Create a new Project in Xcode, and choose the iOS\Application\Single View App template.
 Name the project. Choose Swift for Language. Leave Use Core Data, Include Unit Tests, Include UI Tests unchecked and finish creating the project.
 - Download Highcharts framework from here: Highcharts
or by using Cocoapods by addingpod 'Highcharts', '~> 6.1.0'to your Podfile or Carthage by addinggithub "https://github.com/highcharts/highcharts-ios" >= 6.1.0to your Cartfile. - Now, add Highcharts to your project by simply copying it to your project to the Frameworks folder (create if necessary) and remember to check “Copy items if needed” option.
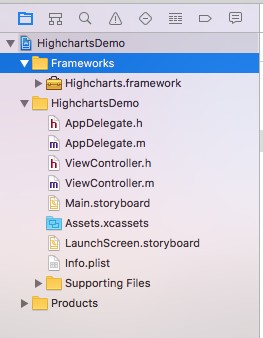
- Click on finish

- Then go to your project settings and add Highcharts to Embedded Binaries.

You are now set to use Highcharts!
2. Set AppDelegate
In your AppDelegate.swift import Highcharts at the top import Highcharts
Add this line to your didFinishLaunchingWithOptions HIChartView.preload()
3. Add HIChartView to your View Controller
In your ViewController.swift file at first import Highcharts import Highcharts, then add property called chartView var chartView: HIChartView!
B. Creating chart to visualize team statistics using Highcharts
Let’s start with creating the chart!
We will create a basic column chart to visualize some stats of the top 4 teams in the UEFA Champions League 2016/17.
In viewDidLoad add the following lines self.chartView = HIChartView(frame: self.view.bounds)
This will create our chartView with defined bounds specified by your view.
Done!
Now let’s consider the chart options. The HIOptions class is responsible for it. This one contains all the information needed to present.
Create instance of HIOptions class let options = HIOptions()
The Object of this class will be used to set up all needed options for the chart. It is worth noting that only a few of them are necessary to create the chart (for example series – which will be discussed later in this article). Let’s start with configuring the chart variable. To do this, we will need HIChart class:
let chart = HIChart()
chart.type = "column"
options.chart = chart
In the second line, in the above code, we have chosen the chart type by type variable from HIChart class. HIChart class offers much more, but in our example this lone variable is sufficient. In the last line, we added chart to the options. It is a good practice to add everything to your options object at once to avoid missing some of them.
At this moment it is worth giving our chart a proper name:
let title = HITitle()
title.text = "UEFA Champions League 2016/17"

let subtitle = HISubtitle()
subtitle.text = "Team statistics"
options.title = title
options.subtitle = subtitle
Title of the chart managed by HITitle class while HISubtitle is responsible for subtitle. In the last two lines, again, we added set up objects to options.
If there is a need to change default axes names, you need to do this yourself:
let xAxis = HIXAxis()
xAxis.categories = [
  "Goals",
  "Assists",
  "Shots On Goal",
  "Shots"
]
options.xAxis = [xAxis]

let yAxis = HIYAxis()
yAxis.min = 0
yAxis.title = HITitle()
yAxis.title.text = "Number"
options.yAxis = [yAxis]
As you can see, variable categories in the HIXAxis class is an array of ‘String’ elements. So, you need to initialize an array with the proper names. In the end, as usual, add this to the options class. Next, we defined Y axis. Variable min determines the start of the axis scale. You might notice that the field title type is HITitle class, which is used to modify the Y axis title. Charts may feature more than one X and Y axes depending on needs, that’s why it is added to options as an array too.
Now, we will discuss the tooltip matters. Consider the following code:
let tooltip = HITooltip()
tooltip.headerFormat = "<span style="0font-size: 15px\";">{point.key}</span>

" tooltip.pointFormat = "" + ""
tooltip.footerFormat = "
<table>
<tbody>
<tr>
<td style="0color: {series.color}; padding: 0\";">{series.name}:</td>
<td style="0padding: 0\";"><b>{point.y}</b></td>
</tr>
</tbody>
</table>
"
tooltip.shared = true
tooltip.useHTML = true
options.tooltip = tooltip
To manage tooltip you need to create HITooltip class. The tooltip is a small widget which is displayed when you tap the specific chart data. You have some variables here which let you format the tooltip. All formatters are well explained in the documentation. In this article, it is worth noting, that you must turn on the useHTML flag to let your chart use the HTML formatting. Whereas, share flag lets you show one tooltip, no matter which of the series you tap from the same category.
At this moment, we can add some chart type specific options:
let plotOptions = HIPlotOptions()
plotOptions.column = HIColumn()
plotOptions.column.pointPadding = 0.2
plotOptions.column.borderWidth = 0
options.plotOptions = plotOptions

options.plotOptions = plotOptions
In the above code, we added the new HIPlotOptions class object. We use only the column field because this is the exact type of our chart – which is why we assigned the HIPlotOptionsColumn class instance to it. poinPadding is padding between each column and borderWidth is the width of the border surrounding each column.
For now, we were talking only about options in our column chart. You may ask: where are the columns exactly? Well, we will add them now!
let realMadrid = HIColumn()
realMadrid.name = "Real Madrid"
realMadrid.data = [36, 31, 93, 236]

let juventus = HIColumn()
juventus.name = "Juventus"
juventus.data = [22, 10, 66, 178]

let monaco = HIColumn()
monaco.name = "Monaco"
monaco.data = [22, 17, 56, 147]

let atleticoMadrid = HIColumn()
atleticoMadrid.name = "Atlético Madrid"
atleticoMadrid.data = [15, 9, 55, 160]

options.series = [realMadrid, juventus, monaco, atleticoMadrid]
In the code above, there are four columns. Each of them contains data from different clubs. Let’s talk about the first one (the rest is done in the same way). At first, we created HIColumn object which is responsible for column implementation. Next, we added a name to it and initialized data’s array with data to present. At this moment, you are probably curious why we didn’t add any of those columns to options. The answer is simple. Columns need to be added to the series first!
Series is a special array containing HISeries objects. Each of chart type objects extends HISeries class, so we can add all our columns to the array without any trouble as you can see in the last line.
Now, when everything is done, we can finish our work:
self.chartView.options = options
self.view.addSubview(self.chartView)
We have added all our options to the HIGChartView created at the beginning. The last thing to do is add our chartView to the view hierarchy. That’s it! We created the chart. The result should look like this:


Leave a Reply to Mustapha Mekhatria Cancel reply