
A technical indicator is a series of data points generated by applying a formula to a security’s price data. Technical indicators are used in forecasting market directions as they allow for an alternative interpretation of the strength and direction of the underlying price action.
Highstock version 6 and later offers more than 20 built-in technical indicators. If you are a trader or just a financial enthusiastic, you would probably like to have the possibility to create some custom technical indicators of your own to Highstock. This is easy to do. Read on to learn how to create a custom technical indicator, step by step.
For this tutorial, I create a simple linear regression indicator. All I need is the indicator’s formula to implement it in the code. If you want to know more about a simple linear indicator just click here.
Technical indicator and Highstock
In Highstock, all technical indicators are new series types; technical indicators are connected to the main series by the linkedTo option.
You can check in this demo how the volume by price (vbp) indicator is linked to the series AAPL:
{
            type: 'candlestick',
            name: 'AAPL',
            id: 'aapl',
            zIndex: 2,
            data: ohlc
        }, {
            type: 'vbp',
            linkedTo: 'aapl',
            params: {
                volumeSeriesID: 'volume'
            },
Each technical indicator requires the method getValues() to be implemented. This method takes two arguments and returns an object. The arguments are the main series and the parameters. The parameters are specific to a technical indicator. Check the structure of the method getValue():
function getValues(series, params) {
  // calculations
  ...
  // end of calculations
  return {
    xData: [...], // array of x-values
    yData: [...] // array of y-values
    values: [...], // array of points
  };
}
In Highstock all technical indicators are series types, and to create a new series, the following method Highcharts.seriesType() is used. I include the indicators module indicators.js, to load the indicators’ core-logic.
You can see that I am calling the linear regression function inside the getValues method. Yes, this is the name of our indicator mathematical function.
src="https://code.highcharts.com/stock/indicators/indicators.js">
Highcharts.seriesType(
  'linearregression',
  'sma',
  {
    name: 'Linear Regression',
    params: {} // linear regression doesn’t need params
  },
  {
    getValues: function (series, params) {
      return this.getLinearRegression(series.xData, series.yData);
    },
    getLinearRegression: getLinearRegression
  }
);
Now, the main highcharts structure to create the indicator is set. Let’s see how to build the indicator’s mathematical function getLinearRegression()
From math to JavaScript…
The simple linear regression formula defined as:
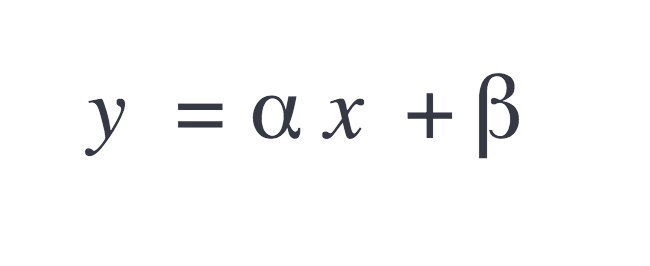
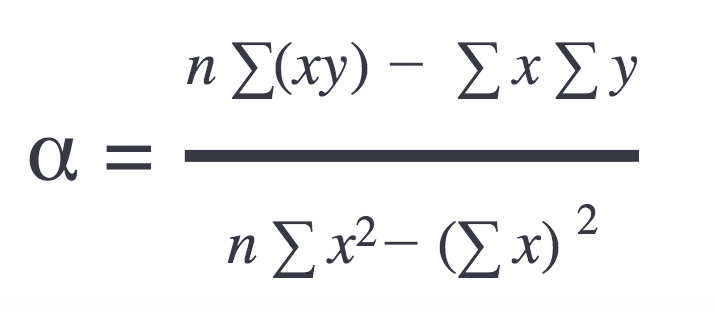
Where the slope is:
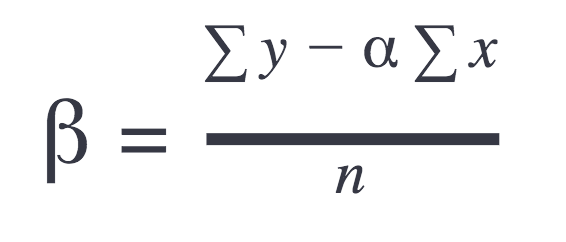
And offset:
The JavaScript of the formulas above looks like this:
function getLinearRegression(xData, yData) {
  var sumX = 0,
      sumY = 0,
      sumXY = 0,
      sumX2 = 0,
      linearData = [],
      linearXData = [],
      linearYData = [],
      n = xData.length,
      alpha, beta, i, x, y;

  // Get sums:
  for (i = 0; i < n; i++) {
    x = xData[i];
    y = yData[i];
    sumX += x;
    sumY += y;
    sumXY += x * y;
    sumX2 += x * x;
  }

  // Get slope and offset:
  alpha = (n * sumXY - sumX * sumY) / (n * sumX2 - sumX * sumX);
  if (isNaN(alpha)) {
    alpha = 0;
  }
  beta = (sumY - n * sumX)/ n;

  // Calculate linear regression:
  for (i = 0; i < n; i++) {
    x = xData[i];
    y = alpha * x + beta;

    // Prepare arrays required for getValues() method
    linearData[i] = [x, y];
    linearXData[i] = x;
    linearYData[i] = y;
  }

  return {
    xData: linearXData,
    yData: linearYData,
    values: linearData
  };
}
That’s it; we are done; our indicator is ready 🙂 and this is how to use:
series: [{
  id: 'main',
  type: 'scatter',
  data: [ ... ]
}, {
  type: 'linearregression',
  linkedTo: 'main'
}]
I also set up two more demos just for fun:
One last thing: To increase the visibility of your chart using the linear regression series, you may want to disable tooltip and/or markers, as the purpose here is more to visualize data than showing exact values. Just got to the seriesType(),and set default options for that series:
Highcharts.seriesType(
  'linearregression',
  'sma',
  {
    name: 'Linear Regression',
    enableMouseTracking: false, // default options
    marker: {
      enabled: false
    }
    params: {} // linear regression doesn’t need params
  },
  {
    getValues: ... ,
    getLinearRegression: ...
  }
);
As you can see, it is easy to create a technical indicator of your own. Feel free to share your own experience about the creating of indicators in the comment section below.
Btw, you are also always welcome to post a technical indicator request on Highcharts UserVoice, as more popular technical indicators will be implemented in the future.


Leave a Reply