If you are familiar with stock analysis, you probably know what a technical indicator is. If not, technical indicators are, in a nutshell, analytical tools that let you examine historical data and forecast future price trends and patterns.
With Highcharts Stock library you rarely have to build custom technical indicators for your financial charts. Instead, dozens of built-in indicators are at your disposal. You may also create and add custom indicators with minimal effort.
In this article, we will explore the most commonly used technical indicators and how you can visualize them with Highcharts Stock to make a financial analysis charting tool that will rival any tool on the market.
Before we take a look at some of the most
commonly used technical indicators, we first need to need to add the main indicator module first, then add the module of the specific indicator. For instance, to use a linear regression indicator, add the following modules:
- Main module
<script src="https://code.highcharts.com/stock/indicators/indicators.js"></script>
- Linear regression indicator
<script src="https://code.highcharts.com/stock/indicators/regressions.js"></script>
Now, let’s now check the list:
1. EMA (Exponential Moving Average)
EMA is a moving average trading indicator. EMA measures the trend direction by using the exponential average of a period of time, then displays the result on a line. The demo below displays a trend direction using a period of 9 days (black line) and 50 days (green line):
link to the demo
To use EMA follow these steps:
- Add EMA module
<script src="https://code.highcharts.com/stock/indicators/ema.js"></script>
- Add this code under series
{
  type: 'ema',
  linkedTo: 'aapl'
}, {
  type: 'ema',
  linkedTo: 'aapl',
  params: {
    period: 50
  }
}
Remark
Notice that the default period is 9. To change the default period use the params option.
2. MACD (Moving Average Convergence Divergence)
The MACD indicator is a powerful technical indicator as it is both a trend-following and a momentum indicator. The MACD is a set of two lines (one faster and one slower) and a histogram:
link to the demo
The first line displays the difference between two moving averages, and the second line is a moving average of the first MACD line, whereas the Histogram is the difference between the two lines.
To use the MACD in your chart follow these steps:
- Add the EMA and the MACD modules, as MACD requires some functionalities from EMA:
<script src="https://code.highcharts.com/stock/indicators/ema.js"></script>
<script src="https://code.highcharts.com/stock/indicators/macd.js"></script>
- Add the MACD option under series with the default setting “12, 26, 9”:
{
  yAxis: 1,
  type: 'macd',
  linkedTo: 'aapl',
  params: {
    shortPeriod: 12,
    longPeriod: 26,
    signalPeriod: 9,
    period: 26
  }
}
3. Bollinger bands
Bollinger bands belong to the volatility indicator type. Bolling bands are a simple moving average with three lines; a line in the middle to represent a simple 20-day moving average and two lines to represent the upper/lower standard deviation:
link to the demo
To use the Bollinger brands follow these steps:
- Add the Bollinger brands module
<script src="https://code.highcharts.com/stock/indicators/bollinger-bands.js"></script>
- Add this code under series:
{
  type: 'bb'
}
4. Fibonacci (Retracements)
The Fibonacci tool is popular among traders, as it offers the possibility to predict how high or low the stock will go using levels or zones:
link to the demo
To use the Fibonacci tool follow these steps:
- Contrary to the rest of the technical indicator, the Fibonacci tool belongs to the annotation module instead of the indicator module, so be sure to add the annotation module
<script src="https://code.highcharts.com/modules/annotations.js"></script>
- Add the zones to the area you want to explore under the feature annotation:
annotations: [
  fibonacciRetracements(Date.UTC(2020, 1, 14), 105, Date.UTC(2020, 2, 14), 320)
],
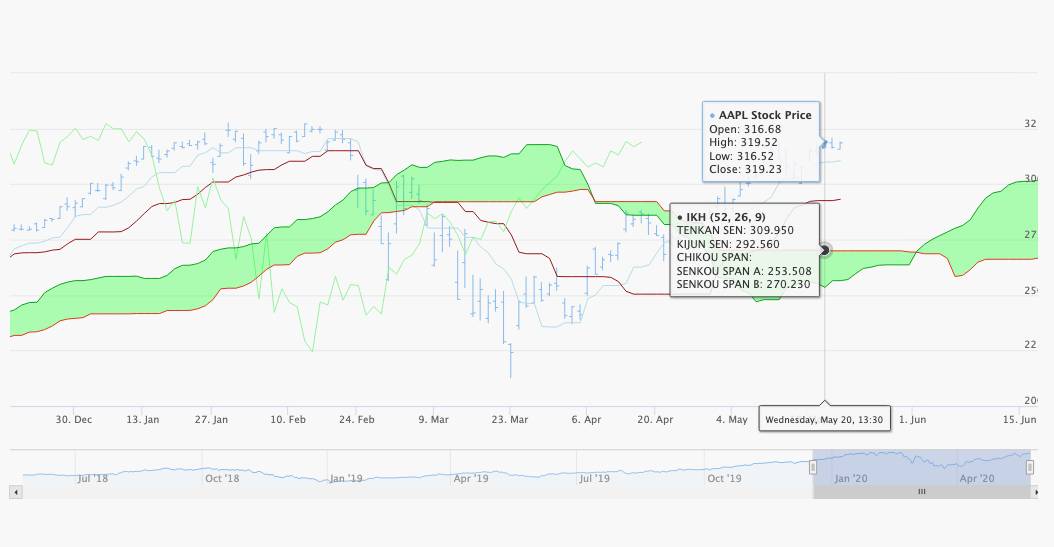
5. Ichimoku Kinko Hyo
Ichimoku indicator is a set of five lines that help traders to see support/resistance levels and trend direction:
link to the demo
To use the Ichimoku indicator follow these steps:
- Add the ichimoku-kinko-hyo module
<script src="https://code.highcharts.com/stock/indicators/ichimoku-kinko-hyo.js"></script>
- Add the five lines under the series feature
{
  type: 'ikh',
  linkedTo: 'aapl',
  tenkanLine: {
    styles: {
      lineColor: 'lightblue'
    }
  },
  kijunLine: {
    styles: {
      lineColor: 'darkred'
    }
  },
  chikouLine: {
    styles: {
      lineColor: 'lightgreen'
    }
  },
  senkouSpanA: {
    styles: {
      lineColor: 'green'
    }
  },
  senkouSpanB: {
    styles: {
      lineColor: 'red'
    }
  },
  senkouSpan: {
    color: 'rgba(0, 255, 0, 0.3)',
    styles: {
      fill: 'rgba(0, 0, 255, 0.1)'
    }
  }
6. RSI (Relative Strength Index)
The relative strength index helps traders to detect overbought and oversold conditions. The RSI visualizes the stock’s strength vs. its price history on one line. The line has a scale from 0 to 100:
link to the demo
<
To use the RSI indicator follow these steps:
- Add the RSI module
<script src="https://code.highcharts.com/stock/indicators/rsi.js"></script>
- Add the RSI line under the series feature
{
  yAxis: 1,
  type: 'rsi',
  linkedTo: 'aapl'
}
7. Stochastic
A stochastic indicator, like the RSI indicator, is used to identify the overbought and oversold conditions. But instead of using one line, the stochastic indicator uses two lines:
link to the demo
To use the stochastic indicator follow these steps:
- Add the stochastic module
<script src="https://code.highcharts.com/stock/indicators/stochastic.js"></script>
- Add the stochastic line under the series feature
{
  yAxis: 1,
  type: 'stochastic',
  linkedTo: 'aapl'
}
Technical indicators help to get better insights from complex graphs by visualizing price and volume trends. And Highchart Stock offers you a range of indicators that can be used in a simplified way.


Leave a Reply