Skip to content
Skip to content
Highcharts
Products
Demos
Support
Resources
Pricing
Blog
Highcharts GPT
Buy Now
Try for Free
Menu
The Latest
News
Tutorials
Use Cases
Webinars
All Posts
HIGHCHARTS BLOG
Category:
Tutorials
Search posts
POPULAR TAGS
.Net
Accessibility
Angular
Python
R
React
ARTICLES BY PRODUCT
Core
Stock
Maps
Gantt
Dashboards
Grid
Stay in touch
No spam, just good stuff
Please enable JavaScript in your browser to complete this form.
Please enable JavaScript in your browser to complete this form.
Email
*
Submit
Tutorials
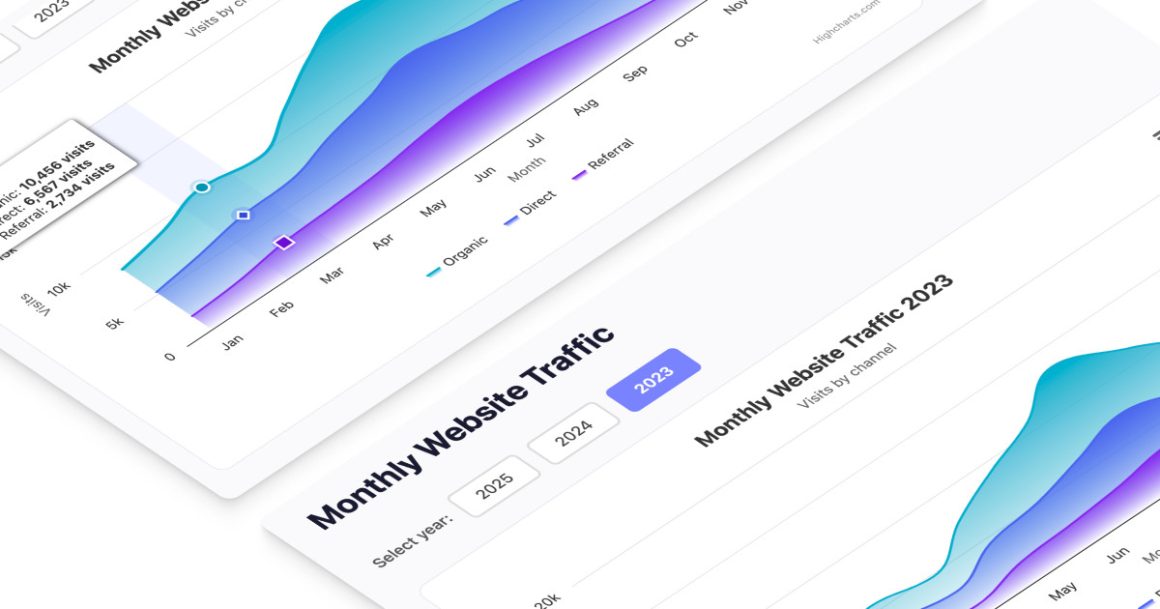
Build a Single Page Application with Highcharts React
12 minutes read
Highcharts Core
,
React
,
Typescript
Tutorials
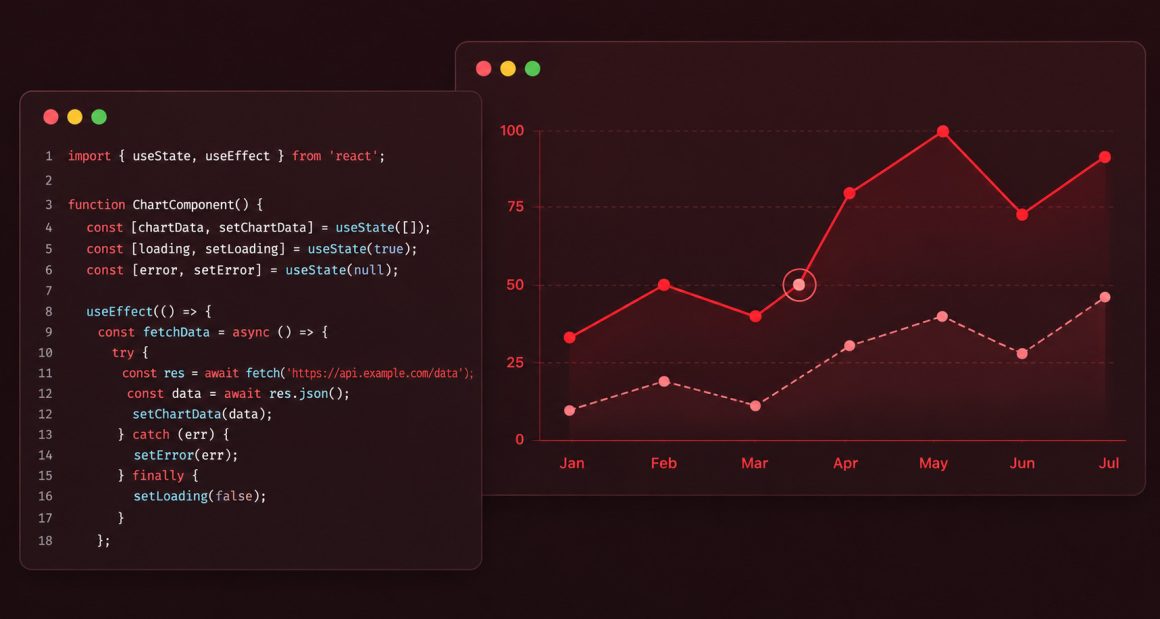
Fetching Real Data for Highcharts in React using useEffect
4 minutes read
React
Tutorials
SaaS analytics dashboards with Highcharts and Morningstar
10 minutes read
Highcharts Dashboards
Tutorials
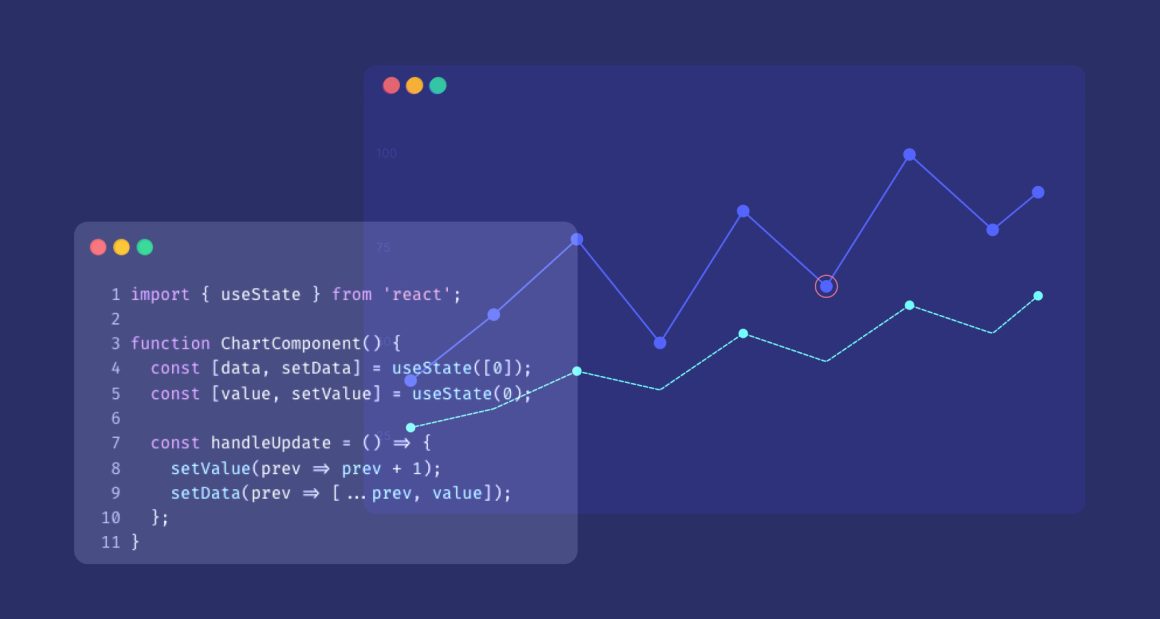
Dynamic Charts in React using useState with @highcharts/react
3 minutes read
React
Tutorials
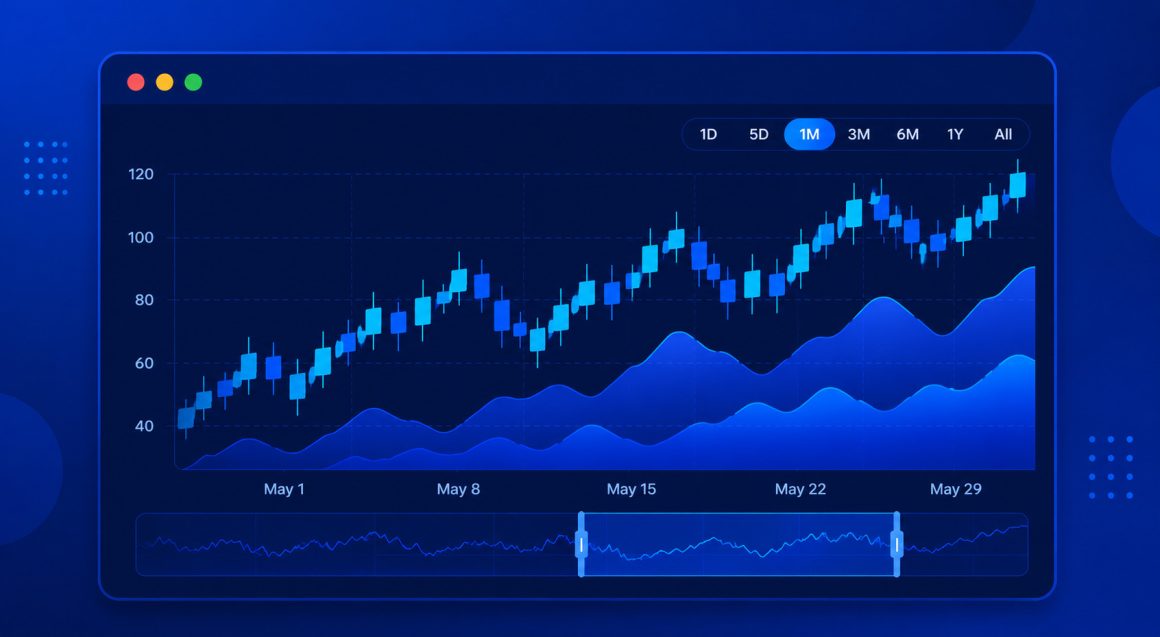
React Stock Chart in Next.js (App Router) Using Highcharts Stock (part 1)
4 minutes read
Highcharts Stock
,
Next.js
,
React
Tutorials
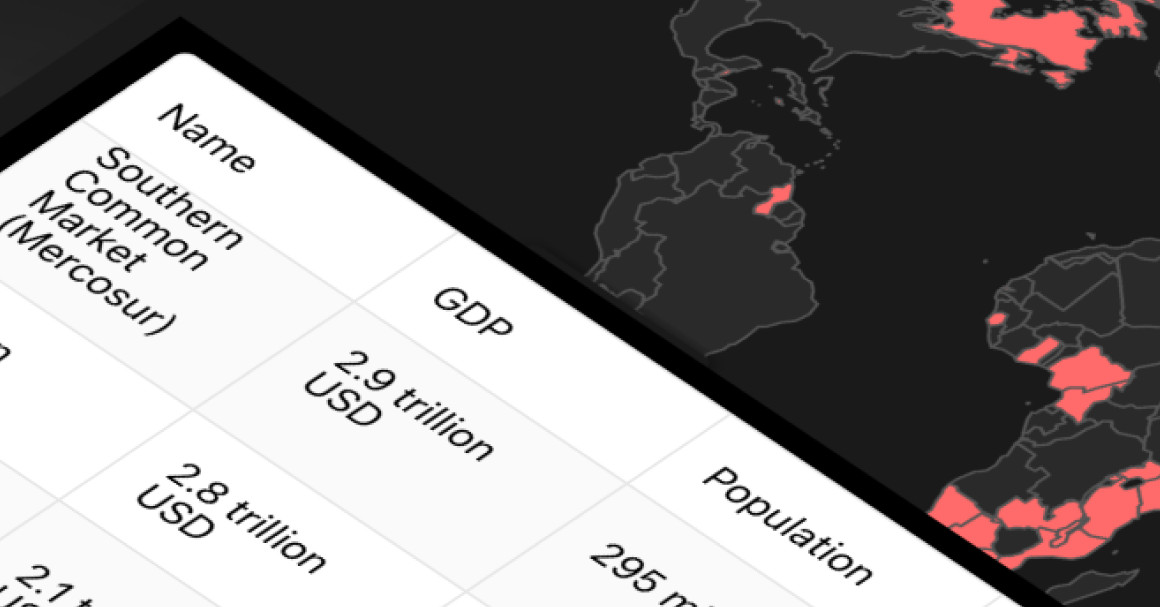
Building an Economic Blocs Map with Highcharts React and Grid
2 minutes read
Highcharts Grid
,
Highcharts Maps
,
JavaScript
,
React
Tutorials
Building an Economic Blocs Map with Highcharts React
5 minutes read
Highcharts Maps
,
JavaScript
,
React
Tutorials
Standard deviation graph applications in statistical analysis and data science
7 minutes read
Data visualization
,
Highcharts Core
,
JavaScript
Tutorials
Radar chart explained: When they work, when they fail, and how to use them right
10 minutes read
Data visualization
,
Highcharts Core
,
JavaScript
1
2
…
18
Next
→