In this tutorial we will build a simple React web app that fetches data from static JSON files and uses that data to create a chart using Highcharts React. We are doing this to mimic fetching data from the server in a Single Page Application (SPA) setting.
We will learn what an SPA actually is, why on-demand data fetching is a defining feature, and how Highcharts fits into that pattern.
What is A Single Page Application?
In a traditional website, every time you click a link or submit a form, the browser makes a request to the server, which sends back a brand new HTML page. This means that the current page is discarded and the new one is rendered from scratch.
An SPA works differently. The browser first loads the web page, but from that point on, the page never fully reloads. When the user interacts with the app, JavaScript handles the updates needed for the resulting view with minimal server-side involvement. The general idea is to keep as much as possible on the client side, and fetch only the data that is needed to load the new page view.
This is what keeps SPAs responsive: you don’t reload the page, you only fetch what you need, when you need it.
How Highcharts Fits In
Highcharts is a client-side charting library that renders interactive charts directly in the browser, which makes it a natural fit for SPAs where charts update without reloading the page.
In an SPA, Highcharts is loaded along with the rest of your app on initial page load. When new data arrives from an API, you pass it to your chart component and it updates instantly. No need for a page reload.
In this tutorial we will build a simple demo that demonstrates this pattern:
- The app with a line chart loads once in the browser
- The user selects a year
- The app fetches only the data for that year
- Highcharts renders the new data by updating the line chart, without reloading the page
Note: For this small demo, it would make more sense to load all data upfront. The point here is to demonstrate a dynamic fetching pattern you can use in larger applications with big datasets, real-time updates, server-side filtering, or multiple independent data sources.
What We Will Build
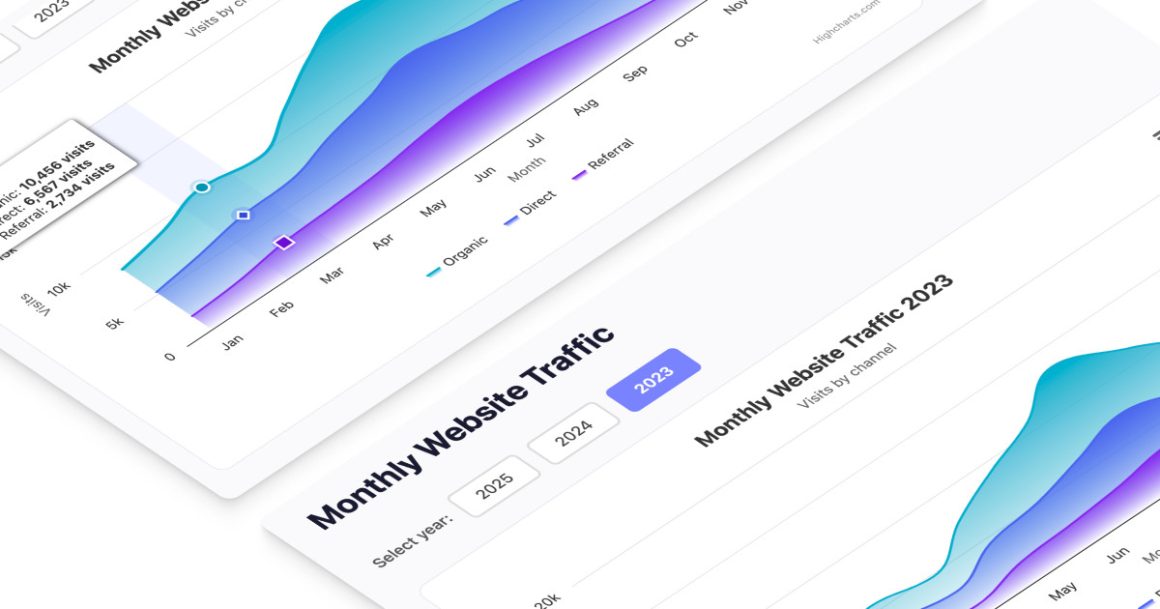
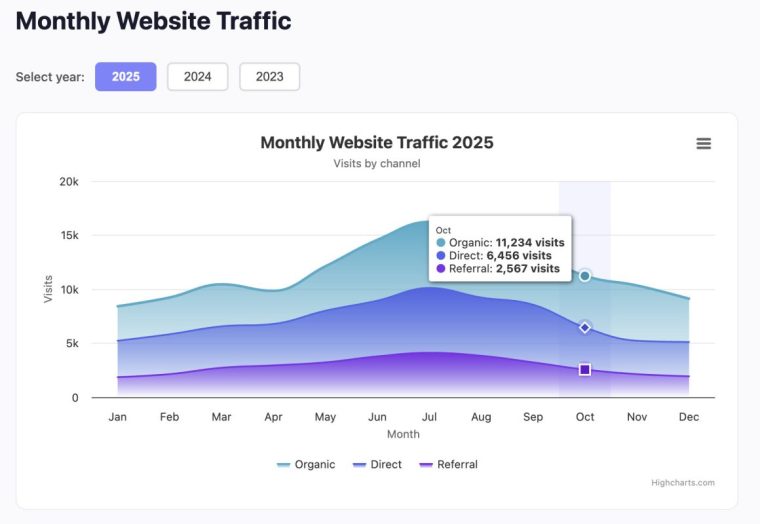
We will use Vite to build a single-page React app showing monthly website traffic data (Organic, Direct, and Referral visits) for the years 2025, 2024, and 2023. The user will select the year by clicking on buttons above the chart, after which the chart will update to show the corresponding data. Yearly data will be fetched over HTTP from static JSON files. We will mimic real-life network latency by adding an artificial delay to the data fetching. A loading spinner will be shown while the data arrives, making the fetch-load-render cycle visible.
Live Demo: Open in Stackblitz
Tech stack:
- Vite 8 – fast development build tool
- React 19 + TypeScript – UI layer with type safety
- @highcharts/react v5.0 – declarative Highcharts React integration
- Vite public assets – static JSON files served as-is over HTTP
A note on this setup: to simplify things, we are using static JSON files to keep the focus entirely on the fetching and rendering pattern. In a production SPA, you would fetch from a real API endpoint. However, the data fetching pattern remains the same regardless of where the data comes from.
Prerequisites
Before you start, make sure you have the following:
- Basic familiarity with React (components, props, state)
- Node.js 18 or later installed (includes npm)
- A modern browser
- A code editor (VS Code recommended)
Building the App
Step 1: Scaffold the Project
Open your terminal in a new folder with a name of your choosing and run:
npm create vite@latestIn the following prompts select . as the project name to use the current folder. Select React as the framework and TypeScript as the variant.
Note: vite@latest currently resolves to Vite 8. The tutorial assumes this version.
When prompted “Install with npm and start now?” select Yes. This will automatically install dependencies and start the Vite dev server on port 5173.
If you close the terminal and come back to the project later, restart the dev server with:
npm run devStep 2: Clean Up Template Files
Vite scaffolded a demo app with files we don’t need. Delete these:
- Contents of the
public/folder. Keep the folder itself, we will use it for data files assets/folder from thesrc/directory
Leave App.tsx in place. We will replace the contents later. For App.css and index.css, copy the versions from the Stackblitz demo above into src/. This tutorial is not about CSS, so we won’t cover styling in detail.
Step 3: Install Highcharts React
Next, let’s install Highcharts React from npm:
npm install @highcharts/reactStep 4: Create the Data Files
Instead of a separate API server, we’ll serve data as plain JSON files from Vite’s public/ directory. Vite automatically makes everything inside public/ available at the root URL, so public/data/traffic-XXXX.json is reachable at /data/traffic-XXXX.json.
Create public/data/traffic-2025.json:
{
    "id": "2025",
    "year": 2025,
    "series": [
        {
            "name": "Organic",
            "data": [
                8423, 9234, 10456, 9845, 12123, 14567, 16234, 15123, 13456,
                11234, 10345, 9123
            ]
        },
        {
            "name": "Direct",
            "data": [
                5234, 5834, 6567, 6789, 8012, 8945, 10123, 9234, 8567, 6456,
                5234, 5123
            ]
        },
        {
            "name": "Referral",
            "data": [
                1867, 2145, 2734, 2956, 3234, 3789, 4123, 3845, 3234, 2567,
                2145, 1945
            ]
        }
    ]
}Next, create the equivalent data files for 2024 and 2023. We haven’t included all the contents here, but just copy the JSON files from the Stackblitz repo linked to above.
These files will be our entire data layer. The Vite dev server will serve them over HTTP, and when we build for production, it is copied into the output folder alongside the app.
Step 5: Define Types
Create src/types.ts in the src folder:
export interface TrafficSeries {
    name: string;
    data: number[];
}
export interface TrafficData {
    id: string;
    year: number;
    series: TrafficSeries[];
}These TypeScript interfaces describe the shape of the data we expect to receive. This lets the editor autocomplete field names and flag typos during development.
Step 6: Create the useFetch Hook
Create src/hooks/useFetch.ts:
import { useState, useEffect } from "react";
interface UseFetchResult<T> {
    data: T | null;
    loading: boolean;
    error: string | null;
}
const SIMULATED_DELAY_MS = 1000;
export function useFetch<T>(url: string): UseFetchResult<T> {
    const [data, setData] = useState<T | null>(null);
    const [loading, setLoading] = useState<boolean>(true);
    const [error, setError] = useState<string | null>(null);
    useEffect(() => {
        // Intentionally do not reset data here. Instead, we keep the previous payload.
        // This lets the chart remain visible while new data is fetched.
        setLoading(true);
        setError(null);
        let cancelled = false;
        const fetchData = async () => {
            try {
                const response = await fetch(url);
                if (!response.ok) {
                    throw new Error(`HTTP error: ${response.status}`);
                }
                const json: T = await response.json();
                // Artificial delay to simulate real-world network latency.
                // In a production app you would remove this.
                await new Promise((resolve) =>
                    setTimeout(resolve, SIMULATED_DELAY_MS)
                );
                if (!cancelled) {
                    setData(json);
                    setLoading(false);
                }
            } catch (err) {
                if (!cancelled) {
                    setError(
                        err instanceof Error
                            ? err.message
                            : "An unknown error occurred"
                    );
                    setLoading(false);
                }
            }
        };
        fetchData();
        // Cleanup: if the component unmounts mid-fetch, discard the result.
        return () => {
            cancelled = true;
        };
    }, [url]);
    return { data, loading, error };
}This hook manages the fetching logic of our app. It accepts a URL and returns three pieces of state: data, loading, and error. On the first render, data starts as null and the hook immediately begins fetching the 2025 data. Once the response arrives, data is updated and loading becomes false. On later refetches, the previous data is kept until the new response arrives.
Some things to note about the useFetch hook:
- Because previous data is kept during refetching, we can keep rendering the existing chart while fetching new data. In the next step, we will use the
chartLoadingclass to fade the current chart while waiting for the data to arrive. - The
cancelledflag prevents an older request from updating state if the component unmounts before it completes.
The artificial delay (setTimeout) is here to make the loading state visible in our demo. It is meant to mimic the loading behavior you would typically see in an SPA that fetches data from a server.
Step 7: Create the Series Wrapper Component
Highcharts React lets you wrap its components in your own functions to keep chart code organised. The wrapper receives props from its parent (TrafficChart, built in the next step) and returns a Highcharts component. Note that no React hooks are allowed inside, because Highcharts React calls wrapper functions directly, outside of React’s rendering cycle.
Create src/charts/TrafficAreaSplineSeries.tsx:
import { Highcharts } from "@highcharts/react";
import { AreaSplineSeries } from "@highcharts/react/series/AreaSpline";
interface TrafficAreaSplineSeriesProps {
    name: string;
    data: number[];
    color: string;
}
export function TrafficAreaSplineSeries({
    name,
    data,
    color
}: TrafficAreaSplineSeriesProps) {
    return (
        <AreaSplineSeries
            name={name}
            data={data}
            color={color}
            options={{
                marker: {
                    fillColor: Highcharts.color(color).brighten(-0.1).get(),
                    lineColor: Highcharts.color(color).brighten(0.8).get(),
                    lineWidth: 1
                },
                fillColor: {
                    linearGradient: { x1: 0, y1: 0, x2: 0, y2: 1 },
                    stops: [
                        [0, color],
                        [1, color + "00"]
                    ]
                }
            }}
        />
    );
}This wrapper owns all the per-series styling: the marker colors derived from the base color via Highcharts.color().brighten(), and the vertical gradient fill. It receives name, data, and color and forwards them as props directly on <AreaSplineSeries> instead of nesting them inside options.
Step 8: Build the Chart Component
Create src/charts/TrafficChart.tsx:
import {
    Chart,
    Title,
    Subtitle,
    XAxis,
    YAxis,
    Tooltip,
    Legend,
    PlotOptions
} from "@highcharts/react";
import type { TrafficData } from "../types";
import { TrafficAreaSplineSeries } from "./TrafficAreaSplineSeries";
import { Exporting } from "@highcharts/react/modules/Exporting";
import { Accessibility } from "@highcharts/react/modules/Accessibility";
interface TrafficChartProps {
    data: TrafficData;
}
const colors = ["#47abc9", "#5064e7", "#7c31e6"];
export default function TrafficChart({ data }: TrafficChartProps) {
    const categories = [
        "Jan",
        "Feb",
        "Mar",
        "Apr",
        "May",
        "Jun",
        "Jul",
        "Aug",
        "Sep",
        "Oct",
        "Nov",
        "Dec"
    ];
    return (
        <Chart
            colors={colors}
            containerProps={{ style: { width: "100%", height: "420px" } }}
        >
            <Title>Monthly Website Traffic {data.year}</Title>
            <Subtitle>Visits by channel</Subtitle>
            <XAxis categories={categories} crosshair={{}}>
                Month
            </XAxis>
            <YAxis max={20000}>Visits</YAxis>
            <Tooltip shared valueDecimals={0} valueSuffix=' visits' />
            <Legend enabled />
            <PlotOptions series={{ marker: { enabled: false } }} />
            {data.series.map((s, i) => (
                <TrafficAreaSplineSeries
                    key={s.name}
                    name={s.name}
                    data={s.data}
                    color={colors[i]}
                />
            ))}
            <Exporting />
            <Accessibility />
        </Chart>
    );
}This is our chart component. It receives TrafficData as a prop and renders a Highcharts chart using JSX components. When new data arrives, you just pass it as props, and React automatically updates the chart. In vanilla Highcharts, you would have to call methods like chart.update() or chart.series[0].setData() to update the chart, but in Highcharts React this happens automatically.
In this tutorial we are focusing on the SPA data fetching pattern, so we won’t dive into the chart configuration, but you can use the Highcharts React docs and Highcharts API-reference if you want to look into the details.
Step 9: Wire It Together in App.tsx
Replace src/App.tsx with:
import { useState } from "react";
import { useFetch } from "./hooks/useFetch";
import TrafficChart from "./charts/TrafficChart";
import type { TrafficData } from "./types";
import "./App.css";
const YEARS = ["2025", "2024", "2023"];
export default function App() {
    const [selectedYear, setSelectedYear] = useState<string>("2025");
    const { data, loading, error } = useFetch<TrafficData>(
        `/data/traffic-${selectedYear}.json`
    );
    const hasChartData = data !== null;
    return (
        <div className='page'>
            <header className='header'>
                <h1>Monthly Website Traffic</h1>
            </header>
            <div className='controls'>
                <span className='label'>Select year:</span>
                {YEARS.map((year) => (
                    <button
                        key={year}
                        onClick={() => setSelectedYear(year)}
                        className={`yearBtn ${selectedYear === year ? "active" : ""}`}
                    >
                        {year}
                    </button>
                ))}
            </div>
            <div className='chartWrapper'>
                {hasChartData && (
                    <div
                        className={`chartContent ${loading ? "chartLoading" : ""}`}
                    >
                        <TrafficChart data={data} />
                    </div>
                )}
                {loading && (
                    <div className='loading'>
                        <div className='spinner' />
                        <p>Pretending to fetch data from a server…</p>
                    </div>
                )}
                {error && (
                    <div className='error'>
                        <p>⚠️ Could not load data: {error}</p>
                        <p className='errorHint'>
                            Make sure the Vite dev server is running and the{" "}
                            <code>public/data/</code> files exist.
                        </p>
                    </div>
                )}
                {!loading && !error && !hasChartData && (
                    <div className='emptyState'>
                        <p>No traffic data available.</p>
                    </div>
                )}
            </div>
        </div>
    );
}When the user clicks a year button, setSelectedYear updates the state. That causes useFetch to re-run with the new URL, which triggers a fresh fetch.
A few things to notice:
hasChartDatais true whenever there is a previous fetch result in memory. BecauseuseFetchpreserves its last data value during a refetch,hasChartDatastaystruewhile the new request is running. The previous chart remains rendered.- While loading, the previous chart receives the
chartLoadingCSS class, which blurs and dims it. This signals that the data is being refreshed without removing the chart entirely. - The stale chart and spinner render at the same time. The stale chart sits behind the loading spinner.
- The empty state only appears on the very first load, before any data has arrived.
This is the SPA pattern: user interaction → state change → targeted data fetch → chart update without a page reload.
Step 10: Run the App
Open your browser and navigate to http://localhost:5173. You should see the chart loaded with 2025 data.
Now try clicking the year selection buttons to see the on-demand fetching pattern. When you click a different year, the chart fades and the spinner appears for about a second while data is fetched, then the chart updates with the new data.
Summary
Here is what we built and what each piece does in our app:
Piece | What it does |
|---|---|
public/data/ JSON files | Static JSON served by Vite. |
useFetch hook | Manages the fetch lifecycle: loading, data, error. |
Simulated delay | Makes the loading state visible for tutorial purposes (remove in production). |
TrafficAreaSplineSeries | Wrapper component that owns per-series styling. |
TrafficChart | Renders fetched data declaratively using Highcharts React. |
App | Connects user interaction, data fetching, and chart rendering. |
Instead of reloading the page, we fetch only the data we need and update the chart component. The server provides raw data; everything else happens in the browser.
Moving to production: Remove the simulated delay in useFetch.ts, replace the static JSON files with a real API endpoint, and add caching to avoid redundant refetches.


Leave a Reply