
In this tutorial, I’ll walk you through a simple 4 steps process to create a data cursor synchronized dashboard using Highcharts and the Highcharts Dashboards (check GIF and demo below):
If you’re new to Highchart dashboards, feel free to take a look at the following article Highcharts Dashboards 101 for a quick introduction. Additionally, if you wonder what could be the reasons you might need to create a data cursor sync dashboard, check the following article 5 reasons why you need DataCursor sync dashboard.
Let’s get started
Step 1: Modules
To begin, I need to include the necessary Highcharts and Highcharts Dashboards modules:
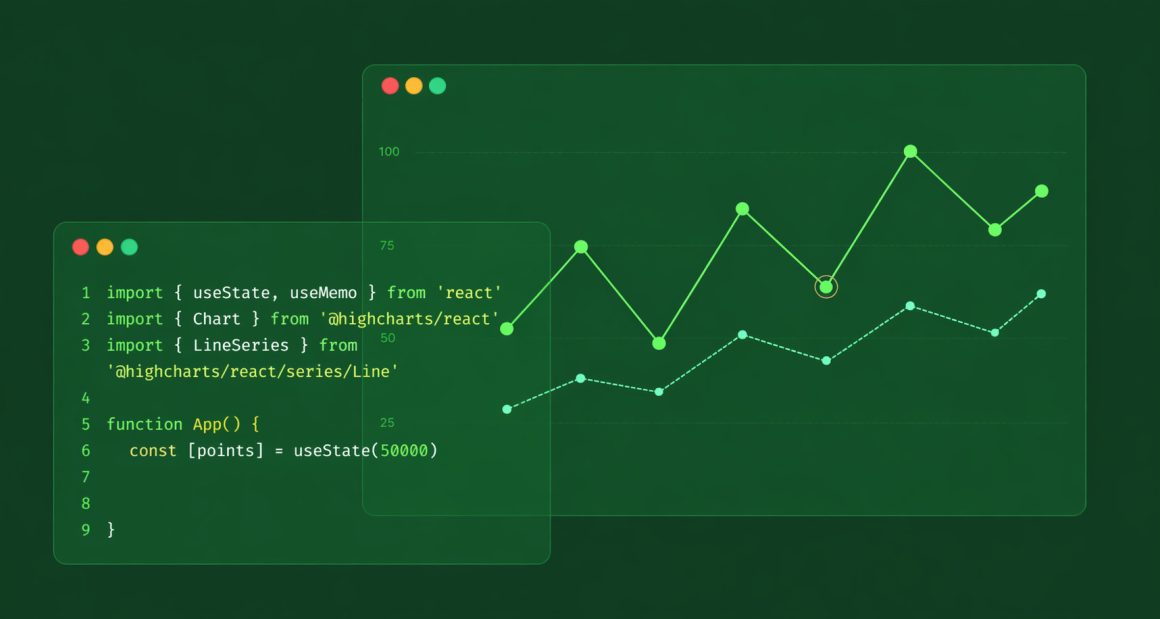
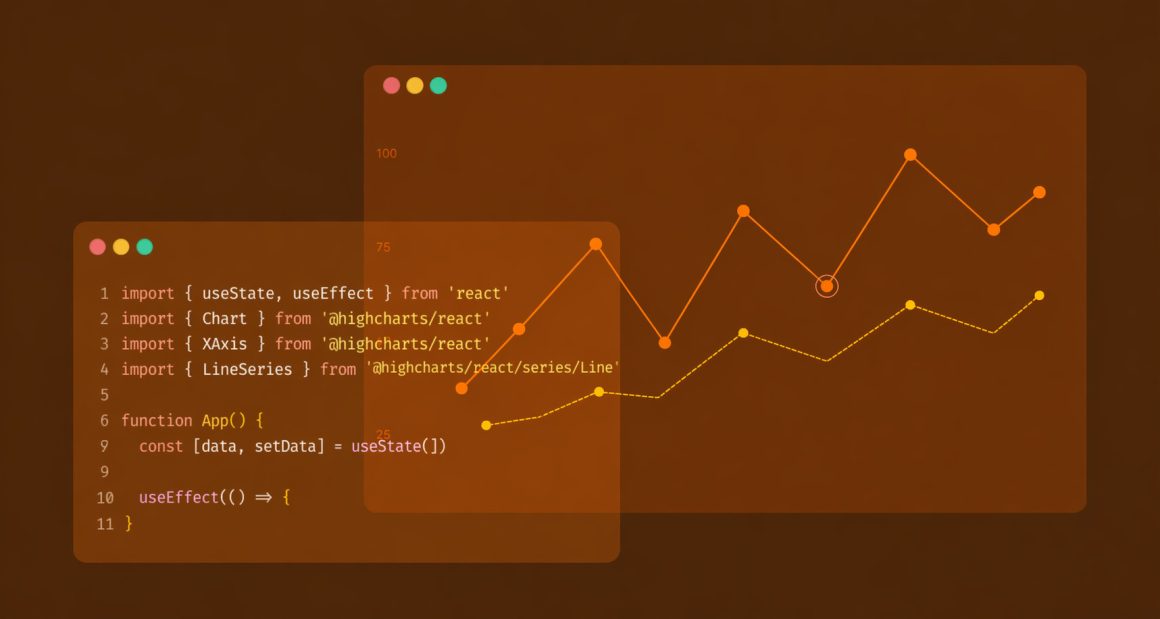
<script src="https://code.highcharts.com/dashboards/dashboards.js"></script>
<script src="https://code.highcharts.com/highcharts.js"></script>
<script src="https://code.highcharts.com/modules/accessibility.js"></script>
<script src="https://code.highcharts.com/dashboards/modules/dashboards-plugin.js"></script>
<div id="container"></div>
Step 2: Building the dashboard
Before building the dashboard, I have to do some magic to initialize a few important variables, such as:
const DataCursor = Dashboards.DataCursor;
const DataTable = Dashboards.DataTable;
const cursor = new DataCursor();
const vegeTable = buildVegeTable();
Here is an explanation:
DataCursorandDataTableare classes provided by the Highcharts Dashboards library for managing cursor data and creating data tables, respectively.cursoris an instance of theDataCursorclass, which will be used to track cursor-related data.vegeTableis a data table created using thebuildVegeTable()function. It contains information about vegetables and their respective amounts.
Now, I can proceed to create the dashboard using the Dashboards.board function. This function takes care of laying out the main dashboard’s layers and components:
Dashboards.board('container', {
  gui: {
    layouts: [{
      id: 'dashboards-layout-1',
      rows: [{
        cells: [{
          id: 'highcharts-dashboards-cell-a0'
        }, {
          id: 'highcharts-dashboards-cell-b0'
        }]
      }, {
        cells: [{
          id: 'highcharts-dashboards-cell-a1'
        }]
      }]
    }]
  },
  components: [{
    cell: 'highcharts-dashboards-cell-a0',
    type: 'Highcharts',
    chartOptions: buildChartOptions('bar', vegeTable, cursor)
  }, {
    cell: 'highcharts-dashboards-cell-b0',
    type: 'Highcharts',
    chartOptions: buildChartOptions('line', vegeTable, cursor)
  }, {
    cell: 'highcharts-dashboards-cell-a1',
    type: 'Highcharts',
    chartOptions: buildChartOptions('pie', vegeTable, cursor)
  }]
});
The layouts contains three cells. The first cell has 2 charts (a bar and a line chart), whereas the second cell has only one chart (a pie chart).
Under component, three Highcharts components are defined to the dashboard, each representing a different chart type (bar, line, and pie).
Step 3: The data
The data structure I am using in this dashboard is very simple; however, feel free to be creative and use the data of your choice 😉
I use the buildVegeTable function to construct a DataTable object with vegetable names and corresponding amounts:
function buildVegeTable() {
  const table = new DataTable({
    columns: {
      vegetable: [
        'Broccoli',
        'Carrots',
        'Corn',
        'Cucumbers',
        'Onions',
        'Potatoes',
        'Spinach',
        'Tomatoes'
      ],
      amount: [
        44,
        51,
        38,
        45,
        57,
        62,
        35,
        61
      ]
    },
    id: 'Vegetables'
  });

  table.setColumnAlias('name', 'vegetable');
  table.setColumnAlias('y', 'amount');

  return table;
}
Step 4: Synchronization
Here is the main piece of the code in this dashboard to synchronize the charts. I use Highcharts event listeners for the chart events that listens for cursor interactions and updates all charts’ tooltips accordingly.
function buildChartOptions(type, table, cursor) {
  return {
    chart: {
      events: {
        load: function() {
          const chart = this;
          const series = chart.series[0];
          cursor.addListener(table.id, 'point.mouseOver', function(e) {
            const point = series.data[e.cursor.row];
            if (chart.hoverPoint !== point) {
              chart.tooltip.refresh(point);
            }
          });
          cursor.addListener(table.id, 'point.mouseOut', function() {
            chart.tooltip.hide();
          });
        }
      }
    },
  };
}
With just four simple steps, you now know how to create your own synchronized dashboard. So, don’t hesitate any longer; dive right in and get started on drafting the best data synchronization dashboard you can imagine.
Related posts
- Stock chart examples using Highcharts Stock
- Stock charting with Highcharts
- Financial charts with Highcharts
- Intraday chart examples using Highcharts
- Dynamic charts in JavaScript with Highcharts
- Data charting with Highcharts


Leave a Reply