Skip to content
Skip to content
Highcharts
Products
Demos
Support
Resources
Pricing
Blog
Highcharts Assist
Buy Now
Try for Free
Menu
The Latest
News
Tutorials
Use Cases
Webinars
All Posts
HIGHCHARTS BLOG
Author: Highsoft
Search posts
POPULAR TAGS
.Net
Accessibility
Angular
Python
R
React
ARTICLES BY PRODUCT
Core
Stock
Maps
Gantt
Dashboards
Grid
Stay in touch
No spam, just good stuff
Please enable JavaScript in your browser to complete this form.
Please enable JavaScript in your browser to complete this form.
ACFormID Email tags
Email
*
Submit
Use Cases
Connecting data: Morningstar and Highsoft present at Norway FinTech Festival
4 minutes read
Data Connectors
,
Finance
,
Highcharts Stock
Tutorials
IoT data visualization with Highcharts: Live weather dashboard
18 minutes read
Highcharts Dashboards
,
Performance
Best Practices
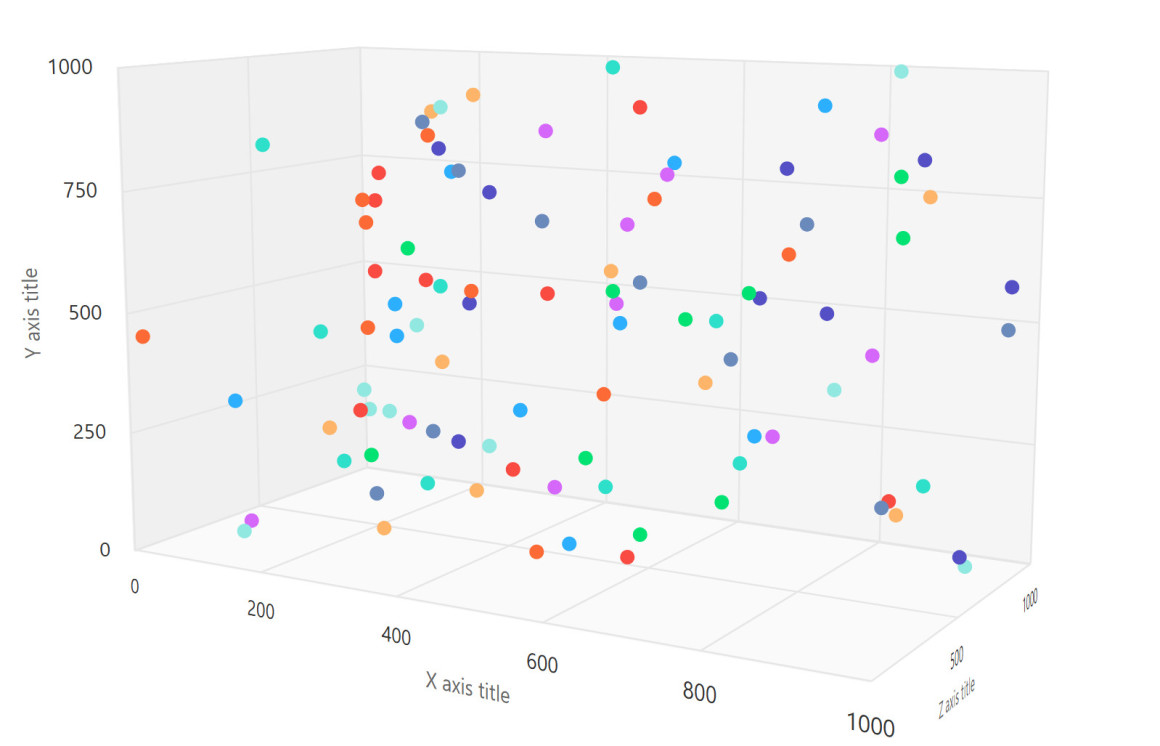
3D graph: Useful visualization or misleading illusion?
8 minutes read
Data visualization
,
Highcharts Core
,
JavaScript
Tutorials
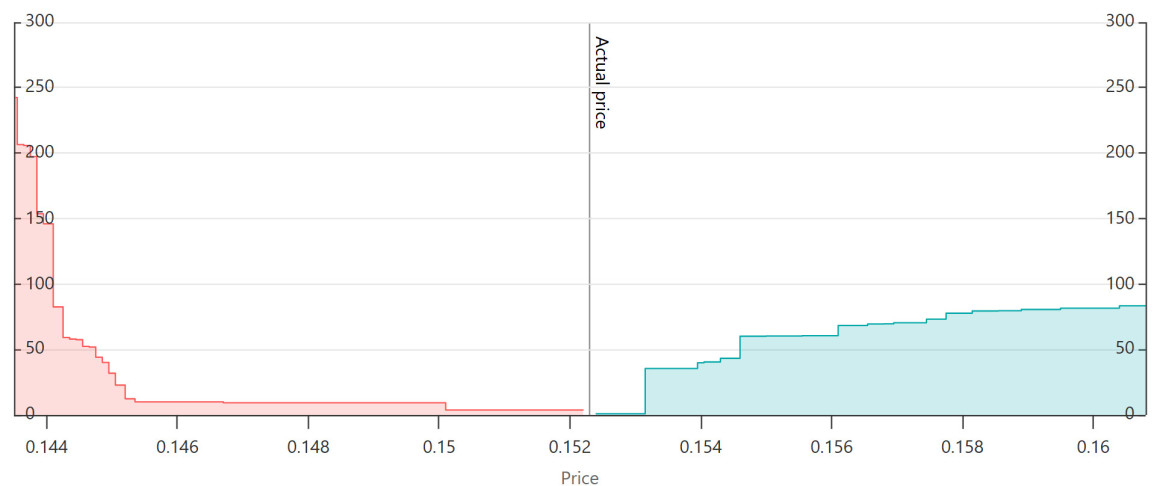
Depth chart: A visual guide to market liquidity and order flow
11 minutes read
Data visualization
,
Finance
,
Highcharts Stock
,
JavaScript
Tutorials
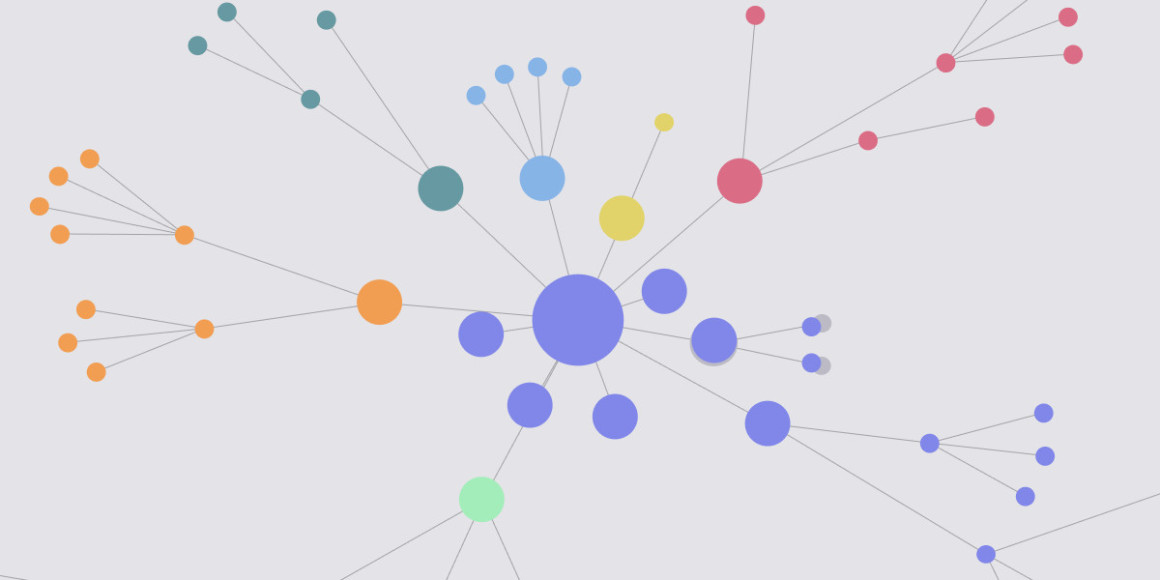
Network graph visualization: Exploring data relationships
6 minutes read
Data visualization
,
Highcharts Core
,
JavaScript
Webinars
Data visualization for everyone: A conversation with accessibility advocate Flora Bazie
4 minutes read
Accessibility
,
Data visualization
Best Practices
Line chart vs. bar chart – choosing the right one for your objectives and data
8 minutes read
Data visualization
Tutorials
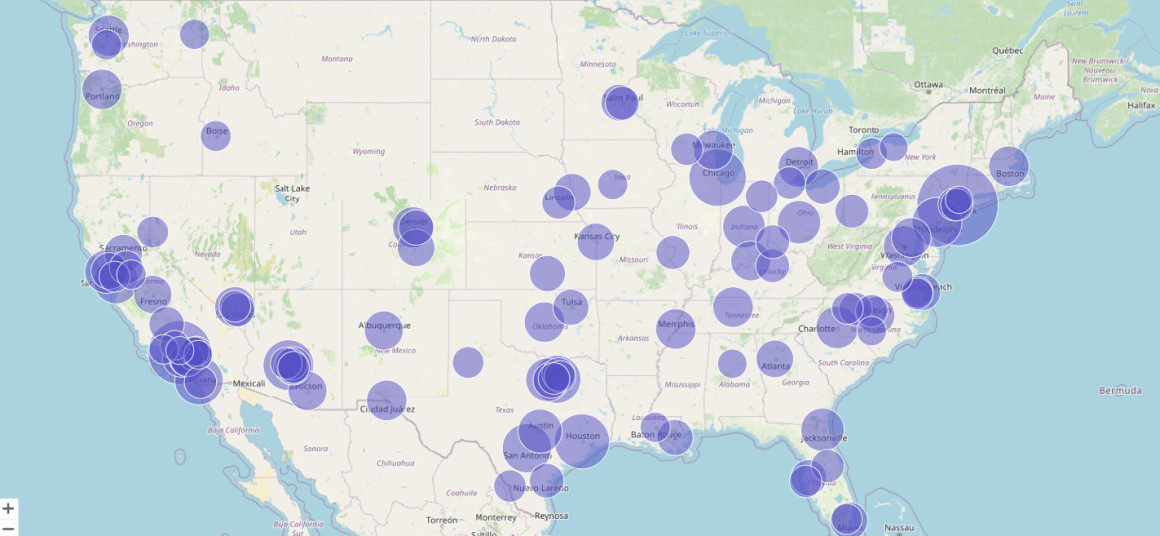
US map of top 100 cities using Highcharts
9 minutes read
Highcharts Maps
,
JavaScript
Best Practices
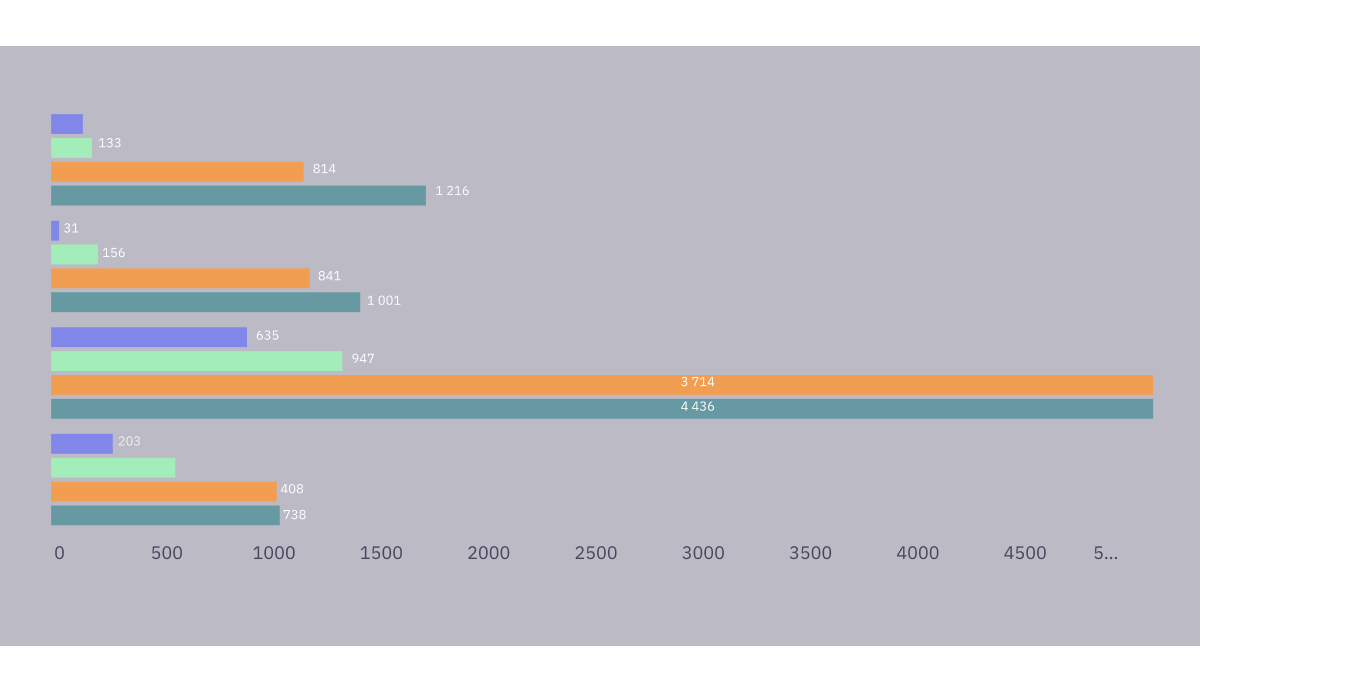
Bar graph vs. histogram: How to distinguish and use them correctly
12 minutes read
Data visualization
←
Previous
1
2
3
4
…
6
Next
→