
Guest post by Jędrzej Ruta: Developer Highcharts Support Engineer.
Morningstar is one of the most trusted names in financial data. But getting that data onto a screen has traditionally meant handling complex requests, and a mapping layer that someone has to maintain forever.
The Highcharts connectors for Morningstar Direct Web Services (DWS) remove that detour. You configure your credentials once, pick the data you want, and the connector hands you a formatted data table that Highcharts can render directly, with easy access to raw data as well.
In this tutorial we will go from an empty HTML file to a working chart built on Morningstar data. We will use the DWS bundle, which targets Morningstar’s newer API, and we will finish by looking at how the same few lines of setup unlock the rest of the DWS data catalogue.
What we will build
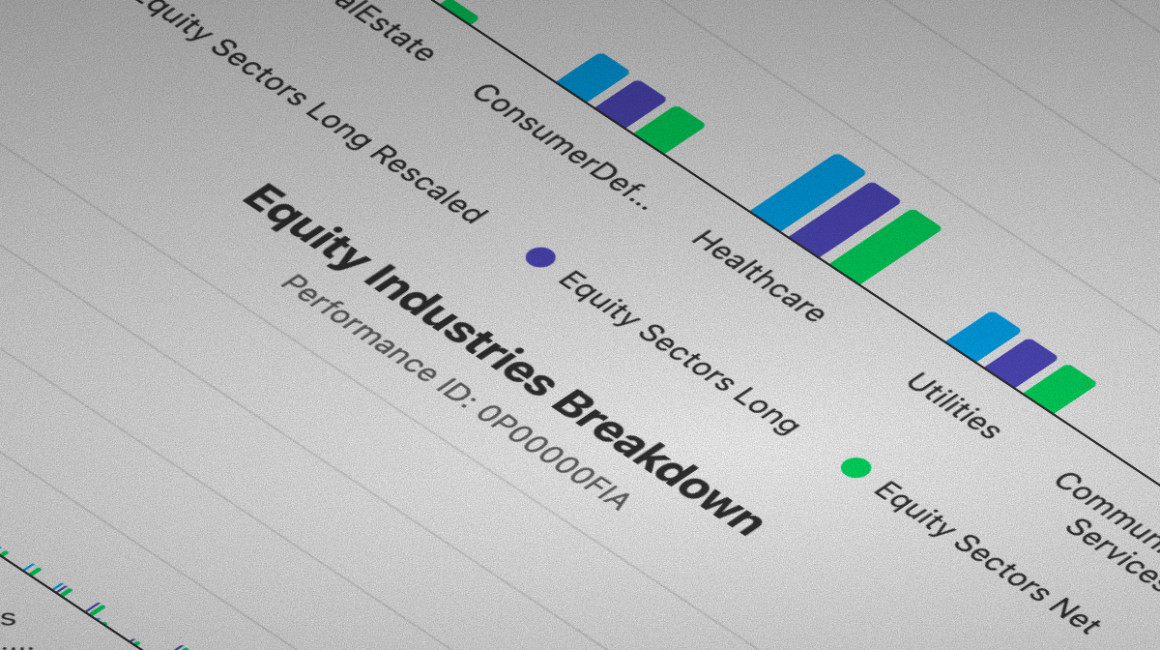
An equity sector chart showing how a fund’s stock holdings are spread across sectors – built with the Investment Details Connector and Highcharts, in three steps from an empty file.
The connectors ship in two flavours, and they are not interchangeable:
connectors-morningstar– the legacy Enterprise Component API, covering Security Details, Screeners, X-Ray, Risk Score, Performance, and more.connectors-morningstar-dws– the newer DWS API, covering the Investment Details API and the Time Series API, with more to come.
This tutorial uses the DWS bundle throughout. Its connectors live under the HighchartsConnectors.MorningstarDWS namespace, while the legacy ones live under HighchartsConnectors.Morningstar.
DWS is a broad service. Morningstar currently lists APIs, covering screeners, scenario analysis, portfolio X-Ray, performance, optimisation, risk scoring, and more. The connectors reach two of them: the Investment Details Connector we are about to use, which returns data views for a single investment, and the Time Series Connector for historical data such as performance and fees.
Building the sector breakdown chart
Step 1: Load Highcharts and the DWS connectors
Create an index.html file. A sector breakdown is a snapshot rather than a time series, so Highcharts Core is all we need here:
<!DOCTYPE html>
<html>
    <head>
        <meta charset="UTF-8" />
        <title>My First Morningstar Chart</title>
        <script src="https://code.highcharts.com/highcharts.js"></script>
        <script src="https://code.highcharts.com/connectors/morningstar/connectors-morningstar-dws.js"></script>
    </head>
    <body>
        <div id="container"></div>
        <script src="./demo.js"></script>
    </body>
</html>
Loading the bundle registers the connectors with Highcharts as a side effect and exposes them on the global HighchartsConnectors object. That is all the wiring there is.
If you are working in an app project rather than a plain HTML page, install the package and import it instead:
npm install @highcharts/connectors-morningstarimport Highcharts from 'highcharts';
import { InvestmentsConnector } from '@highcharts/connectors-morningstar/dws';One difference to keep in mind as you read on. The <script> tag exposes everything on the global HighchartsConnectors object, which is why this tutorial writes new HighchartsConnectors.MorningstarDWS.InvestmentsConnector({ ... }). An ES module sets no such global, so there you write new InvestmentsConnector({ ... }) with whatever you imported. Everything else is the same. See Installation for more on the two loading methods.
Step 2: Configure the Investment Details Connector
Now create demo.js. Because loading data is asynchronous, we will build the chart inside an async function and call it at the end of the file. The InvestmentsConnector describes a single security, and you choose what you want to know about it by naming one or more of the available converters:
async function createChart () {
    const connector = new HighchartsConnectors.MorningstarDWS.InvestmentsConnector({
        api: {
            access: {
                token: 'your_access_token'
            }
        },
        security: {
            id: '0P00000FIA'
        },
        converters: {
            EquitySectorsBreakdown: {}
        }
    });
    ...
Three of those options deserve a closer look.
security takes a single id – the Investment Details API describes one investment at a time. The identifier above is a Morningstar performanceId.
converters is the heart of this connector. Rather than one connector per data type, a single instance can request several converters at once, and each one populates its own named data tables. Here we ask for just EquitySectorsBreakdown; the empty object is not a placeholder to fill in, since most converters need no options at all. Some accept startDate and endDate to bound a historical series:
converters: {
    EquitySectorsBreakdown: {},
    AssetAllocationBreakdown: {},
    EquityStyleBox: {
        startDate: '2025-01-01',
        endDate: '2025-12-01'
    }
}
That is one request block and one load() for three datasets – a fund profile page with six panels needs one connector with six converters, not six connectors.
api.access carries your credentials. The token is a Morningstar access token, which the connector sends as an Authorization: Bearer header on every request. Issue it from your own backend rather than hard-coding it in the page, so the credentials never reach the browser. To learn more about authenticating yourself in Morningstar API, see the authentication page.
const { token } = await getToken();

const connector = new HighchartsConnectors.MorningstarDWS.InvestmentsConnector({
    api: {
        access: { token }
    },
    // ...security and converters as above
});
Step 3: Load the data and render the chart
This is the step where the connector’s design pays off. EquitySectorsBreakdown populates three data tables, already shaped for Highcharts, each retrieved by name:
await connector.load();const superSectorsTable = connector.getTable('EqSuperSectors'),
sectorsTable = connector.getTable('EqSectors'),
industriesTable = connector.getTable('EqIndustries');The three tables are the same breakdown at increasing detail. EqSuperSectors groups holdings into Morningstar’s three super sectors – cyclical, defensive, and sensitive. EqSectors splits those into the eleven sectors most readers will recognise, and EqIndustries goes one level deeper.
Every table has a Type column naming its categories, plus one column per measure: PercLong, PercLongRescaled, PercNet, and PercShort.
Hand the table to the chart with the dataTable option, then let each series pick its columns through dataMapping: name for the category label, y for the value. The series name defaults to the column it maps to, so there is nothing else to wire up:
    ...
    Highcharts.chart('container', {
        chart: {
            type: 'column'
        },
        title: {
            text: 'Equity Sectors Breakdown'
        },
        dataTable: sectorsTable,
        xAxis: {
            type: 'category'
        },
        yAxis: {
            title: {
                text: 'Sector weight'
            },
            labels: {
                format: '{value}%'
            }
        },
        tooltip: {
            valueSuffix: '%',
            valueDecimals: 2
        },
        series: [{
            dataMapping: { name: 'Type', y: 'PercLong' }
        }, {
            dataMapping: { name: 'Type', y: 'PercNet' }
        }]
    });
}

createChart();
That is your first chart from Morningstar data: one connector, one converter, and no mapping layer in between.
dataTable and dataMapping need Highcharts 13 or newer. On Highcharts 12, read the columns yourself and assign them to series.data instead – e.g. sectorsTable.getColumn('PercLong') in place of the mapping above.
One more detail worth knowing: the connector exposes the security’s performanceId through its metadata, which is handy for a subtitle:
subtitle: {
    text: `Performance ID: ${connector.metadata.EquitySectorsBreakdown.performanceId}`
}
What else DWS gives you
EquitySectorsBreakdown is one of eight converters currently available on the Investment Details Connector. The rest follow the identical pattern – name the converter, read its tables:
- Asset Allocation Breakdown – allocation across asset classes, with general, Canadian, and underlying-instrument views.
- Country and Regional Exposure Breakdown – geographic exposure by region and country, for equity, fixed income, and revenue.
- Equity Sectors Breakdown – sector exposure at super-sector, sector, and industry levels, in the
EqSuperSectors,EqSectors, andEqIndustriestables. - Fixed Income Sectors Breakdown – fixed-income sector exposure across super, primary, and secondary sectors, plus per-region tables.
- Equity Style Box – Morningstar’s proprietary style box and stock grades, as both a current grid and a historical series.
- Equity Residual Risk and Return Sensitivity – Alpha, Beta, and RSquare at daily and monthly granularity.
- Equity Aggregates Residual Risk and Return Sensitivity – aggregate residual-risk statistics with their company counts.
- Prospectus Fees – management, administration, and distribution fees, sales loads, and expense ratios.
The other connector: Time Series
Investment details are one half of what the connectors cover. The other is the TimeSeriesConnector, which targets Morningstar’s Time Series API and returns historical data for up to 25 securities in a single request.
It follows the same three beats you just used – and, like the code above, it belongs inside an async function. Two things differ: instead of converters you pick data with a category and a dataPoint, and instead of one security you pass a list:
const growthConnector = new HighchartsConnectors.MorningstarDWS.TimeSeriesConnector({
    api: {
        access: {
            token: 'your_access_token'
        }
    },
    ids: [{
        id: '0P00000FIA',
        idType: 'performanceId'
    }, {
        id: '0P00002PB8',
        idType: 'performanceId'
    }],
    category: 'performance',
    dataPoint: 'growth',
    startDate: '2024-10-30',
    endDate: '2025-10-30',
    currencyId: 'EUR'
});

await growthConnector.load();
category and dataPoint map directly onto Morningstar’s Time Series API paths: take the two segments immediately after time-series/v1/, so .../time-series/v1/performance/growth/ becomes category: 'performance' and dataPoint: 'growth'. Categories include performance, fees-expenses, portfolio-holdings, and many others with more to come in the future. performanceId is the default idType, so you can omit it, and currencyId takes an ISO 4217 code – worth setting explicitly when you compare funds domiciled in different markets, since it otherwise defaults to each investment’s own base currency.
Reading the result differs from the tables above. There is a single table whose first column is Date, holding yyyy-MM-dd strings sorted ascending. Request one security and the values land in a Value column; request several and each is suffixed with that security’s performanceId – always the performanceId, whatever idType you asked with. The same pairing works here, with x taking the date column instead of name:
Highcharts.stockChart('container', {
    dataTable: growthConnector.getTable(),
    series: [{
        name: 'Capital Group Global Equity Fund (LUX) B',
        dataMapping: { x: 'Date', y: 'Value_0P00000FIA' }
    }, {
        name: 'Dodge & Cox Stock Fund Class I (DODGX)',
        dataMapping: { x: 'Date', y: 'Value_0P00002PB8' }
    }]
});
Both securities share one table, so each series names its own value column, and Highcharts Stock parses the yyyy-MM-dd strings into dates for you. Note the different bundle: a time series wants highstock.js rather than the highcharts.js we loaded in Step 1.
Two things that will save you time
Develop against pre-fetched JSON. Both DWS connectors accept an api.json option that bypasses authentication and the network entirely, using a payload you supply. It takes priority over postman and online API settings, which makes it ideal for local development, demos, and tests where you do not want to burn API calls:
const connector = new HighchartsConnectors.MorningstarDWS.InvestmentsConnector({
    api: {
        json: {
            AssetAllocationBreakdown: {
                assetAllocationBreakdown: {
                    assetAllocCashPercLong: 4.49556,
                    assetAllocEquityPercLong: 95.50442
                },
                identifiers: {
                    performanceId: '0P00000FIA'
                },
                metadata: {}
            }
        }
    },
    security: {
        id: '0P00000FIA'
    },
    converters: {
        AssetAllocationBreakdown: {}
    }
});
For multi-converter requests, key the object by converter name, exactly as above.
Set the region explicitly. Unless you say otherwise, the DWS connectors send their requests to Morningstar’s Americas endpoint. If your account is served by another region, set api.url:
api: {
    url: 'https://www.emea-api.morningstar.com/',
    access: {
        token: 'your_access_token'
    }
}
The three regional endpoints are https://www.us-api.morningstar.com/ (Americas, the default), https://www.emea-api.morningstar.com/, and https://www.apac-api.morningstar.com/.
Using the connectors with Dashboards
Everything above creates connectors by hand, which is the pattern for Highcharts Core and Stock. With Highcharts Dashboards you do not have to: loading a bundle registers the connectors with the Dashboards registry automatically, and they become available in the data pool like any other connector type. Reference them as MorningstarDWSInvestments and MorningstarDWSTimeSeries:
Dashboards.board('container', {
    dataPool: {
        connectors: [{
            id: 'equity-sectors',
            type: 'MorningstarDWSInvestments',
            api: {
                access: {
                    token: 'your_access_token'
                }
            },
            security: {
                id: '0P00000FIA'
            },
            converters: {
                EquitySectorsBreakdown: {}
            }
        }]
    }
    // ...gui and components
});
Components then bind to a table by name through dataTableKey, so a Grid or chart reads the connector’s output the same way the chart above did – here you would get tables named EqSuperSectors, EqSectors, or EqIndustries.
More details and licensing
The full option reference for every connector and converter lives in the Morningstar connectors documentation, and each converter page lists the demos that go with it.
Using the connectors requires a Highcharts Partner Data License and a Morningstar Direct Web Services account. If you would like to talk through your specific use case, or see the connectors running against your own data, reach out to our team.






Leave a Reply