
Business users often approach their data with specific questions in mind. “What changed last quarter?” “Why did it change?” “What happens if the trend continues?”
Traditionally, finding those answers might require understanding underlying data structures, writing SQL queries, configuring filters, choosing the right visualization, and building reports to make sense of the results. In other words, a lot of steps across numerous tools and tasks.
If only getting the answers could be as simple as asking the questions.
Veezoo is an Agentic Analytics platform designed to make it that simple. It enables users to explore their data using natural language prompts. Ask Veezoo’s chat what you want to know and get back charts you can act on and probe for deeper insights. When you’re ready, bring them together in interactive dashboards for monitoring and sharing.
We’re happy that Veezoo chose Highcharts as the default visualization layer behind those answers. And as it turns out, Veezoo and Highcharts have a lot in common when it comes to building reliable, secure data experiences. Read on to learn why Veezoo picked Highcharts and how Highcharts helps turn trusted data into visual answers.
A visualization layer built for any question
“We picked Highcharts due to the great default options that it delivers out of the box, as well as its client-side architecture.”
Traditional dashboards are usually designed around a known set of metrics and questions. A developer can anticipate what data a chart will contain and configure the visualization accordingly. Veezoo’s conversational approach to analytics changes that workflow.
One user might ask for revenue over time. Another might want to compare products across markets. Another might ask why sales dropped last month, prompting Veezoo to perform a multi-step analysis across different dimensions and time periods.
The visualization layer therefore has to accommodate analytical results that weren’t necessarily known when the application was built. This is where Highcharts’ flexible configuration and extensive customization options come in, giving Veezoo a charting foundation that can adapt to dynamically generated data and a wide range of visual outputs.
Veezoo currently offers more than 20 built-in visualization types, along with controls for colors, labels, axes, and formatting. Users can even ask Veezoo to change or refine a visualization. Behind the scenes, Highcharts provides the flexibility to update chart configurations as the analysis evolves, while keeping the experience visually consistent.
Because Veezoo generates results at query time, its charts can’t be pre-built. Instead, Veezoo programmatically constructs a Highcharts configuration object from each query result. The breadth of options available within that configuration allows a single code path to accommodate visualizations ranging from a simple time series to a Sankey diagram.
And for an application capable of generating such a broad range of analyses, a consistent visual experience helps build familiarity and trust.
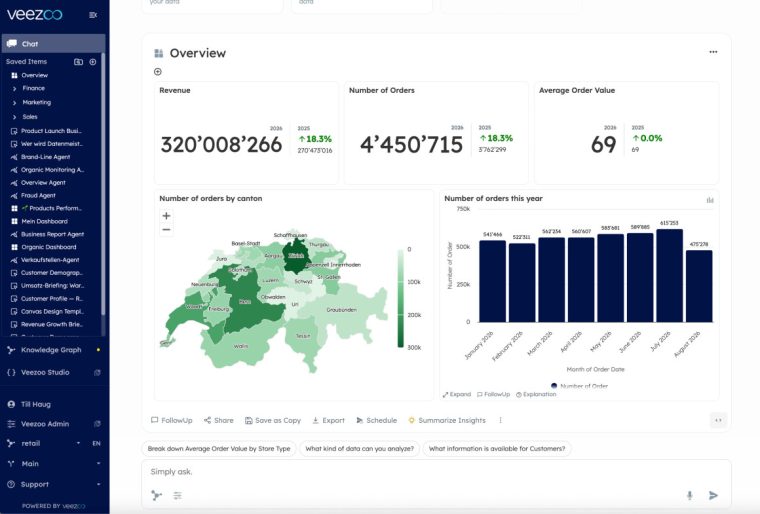
Veezoo uses Highcharts as its default visualization layer to turn dynamically generated analyses into consistent, interactive charts and dashboards.
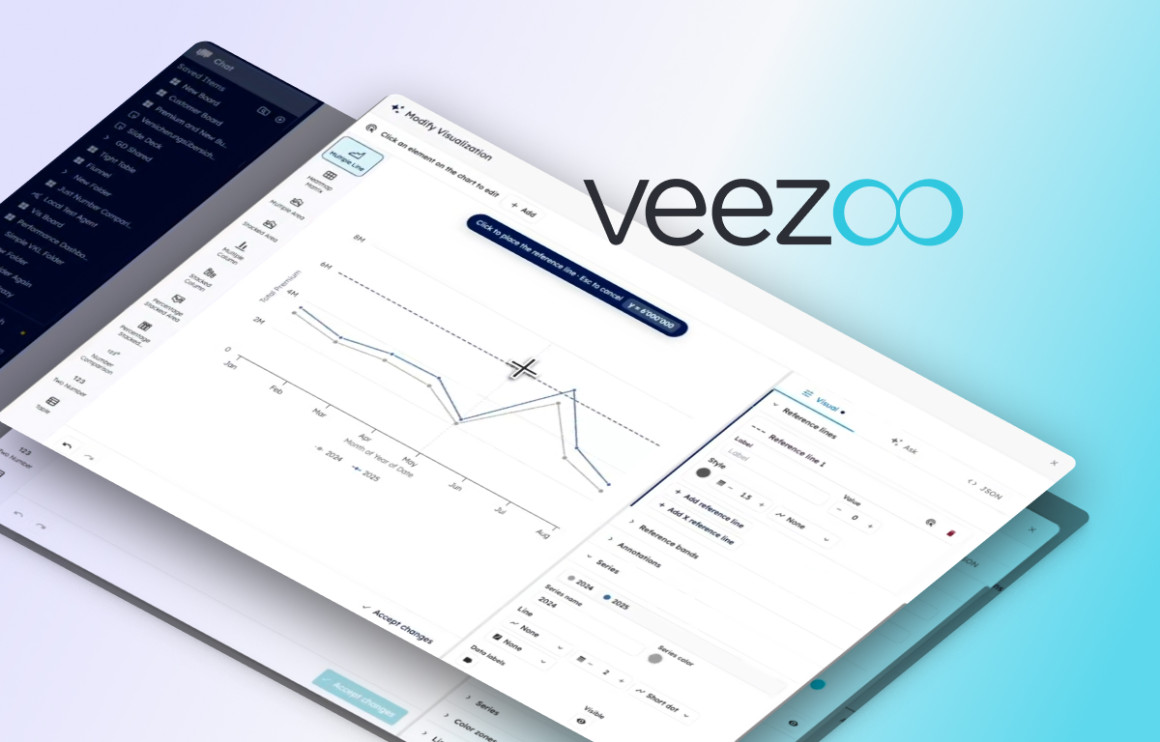
Veezoo has also built its own chart editor on top of Highcharts, allowing users to restyle series, add annotations and reference lines or bands, and adjust elements such as axis labels. Veezoo determines which Highcharts options to expose for each visualization type.
A natural fit on data privacy
As Veezoo and Highcharts both know, building trust with customers also depends on what happens to their data behind the scenes and how much control they retain over it.
Veezoo operates as a query layer rather than a data repository. Queries execute directly against the customer’s data warehouse, without Veezoo copying or ingesting the underlying transactional data.
Highcharts is a good fit for this privacy-first architecture as it applies that same approach to the visualization layer. Standard Highcharts visualizations render client-side, in the user’s own environment, without sending data elsewhere for processing.
For organizations working with sensitive business data, this can help reduce risk and simplify compliance. From querying the data with Veezoo to visualizing the results with Highcharts, organizations retain control over where their data lives and how it is handled.
Tools built to keep organizations in control
“Our whole design premise is that AI should be constrained to the layer where it adds value and kept away from the layers where trust is built.”
A challenge facing organizations when it comes to adopting AI is how to gain the benefits of natural-language interfaces and automated analysis without giving up control over sensitive data, business logic, or how answers are produced.
Veezoo addresses that challenge with its Knowledge Graph, a semantic layer that defines an organization’s business concepts, metrics, governance rules, and KPIs. Rather than allowing an LLM to write SQL directly, Veezoo reasons over these predefined concepts and translates each question into Veezoo Query Language (VQL). A deterministic, rule-based process then compiles VQL into SQL.
The approach helps keep AI away from raw database tables while giving users a way to inspect and verify the logic behind their results. Even the chart titles, filters, and labels accompanying Veezoo’s Highcharts visualizations are rendered directly from VQL rather than generated by AI.
Customers can also control whether an LLM sees the query results to produce AI-powered summaries and insights. And Veezoo does not use customer data or queries to train AI models, so nothing you ask becomes part of a shared model.
That emphasis on keeping organizations in control of when and how AI interacts with their data is one we recognize at Highcharts as well.
As we’ve begun adding optional AI capabilities to our charts through Highcharts Orbit, we’ve made it possible for organizations whose security or data-processing requirements don’t permit AI use to enable or disable AI-powered features.
Although Veezoo and Highcharts take different approaches to different problems, the underlying principle is similar: AI can expand what people can do with their data without requiring organizations to surrender control over it.
From trusted data to trusted visual answers
“Highcharts has been a component we haven’t had to think about much, which is one of the highest compliments we can give.”
Veezoo sets out to make asking sophisticated questions of business data feel as natural as asking a colleague. Making the question easy, however, is only half of that experience. The answer has to be accurate, understandable, and useful.
Veezoo’s Knowledge Graph and VQL provide the governed foundation behind those answers. And Highcharts helps turn the results into interactive visualizations users can explore and understand. Together, they help shorten the distance between having a question about your business and seeing an answer you can act on.
With Highcharts handling the visualization layer, Veezoo can focus its resources on its core differentiator: “making sure the number in the chart is the right number.”
Veezoo is free to try. Experiment with one of its sample datasets or connect your own data using the Knowledge Graph Builder and start asking questions. And if you’d like to explore the visualization technology behind the answers, Highcharts is free to try, too. Head over to our download page to learn how to get started.






Leave a Reply