
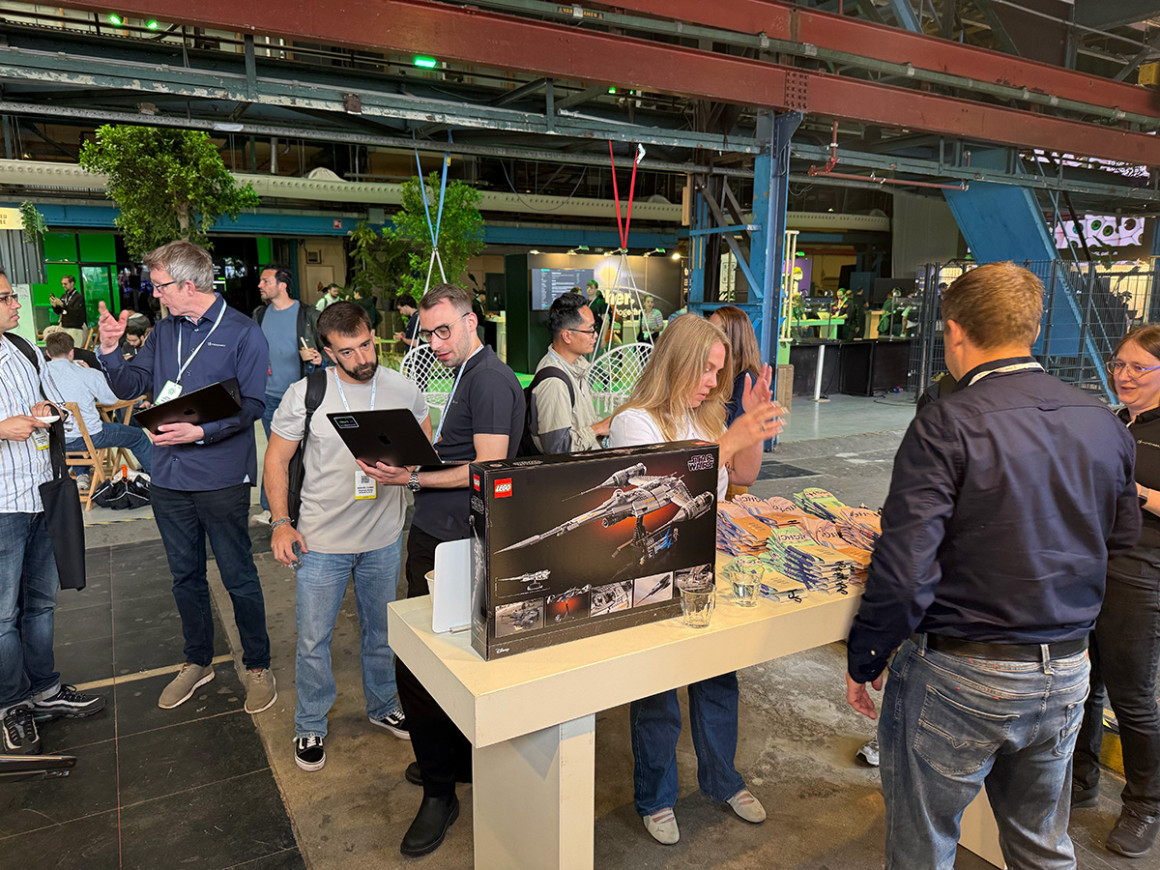
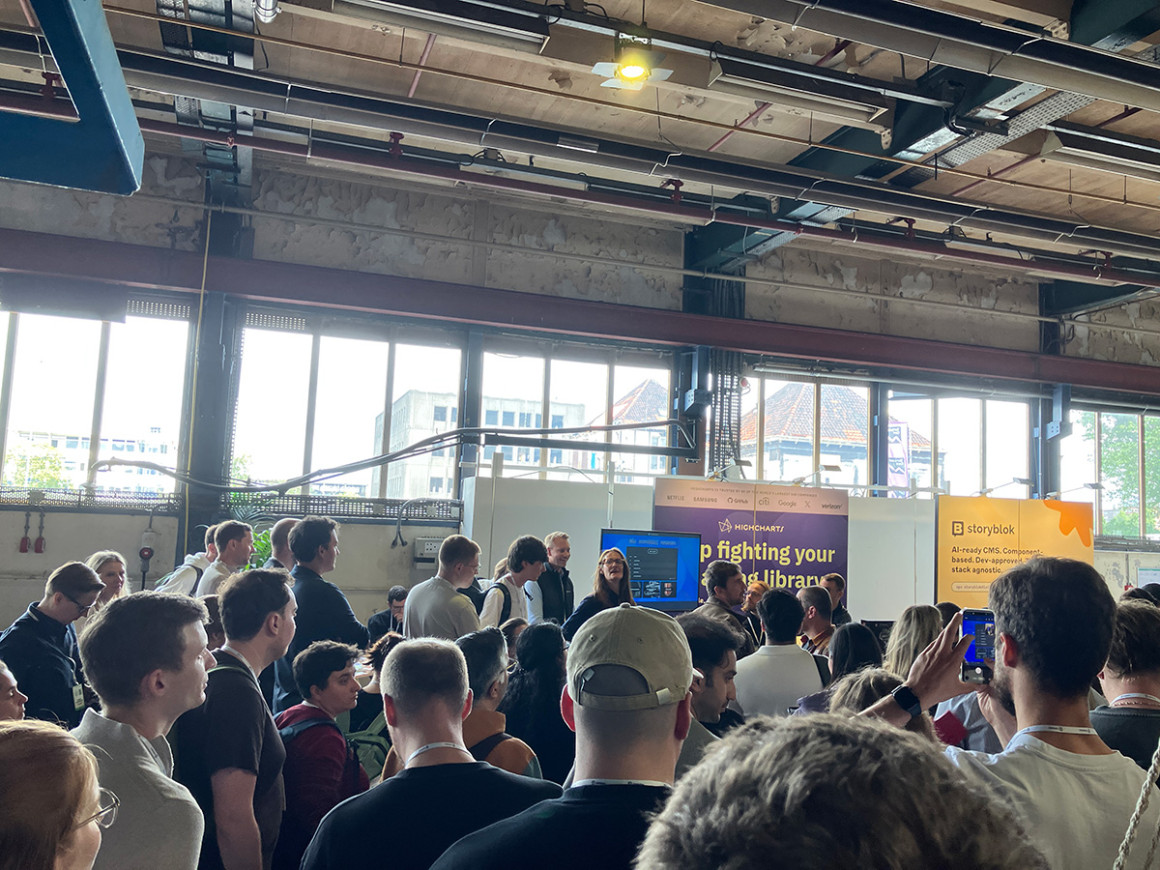
React Summit 2026 brought thousands of developers to Amsterdam to talk about the future of React, frontend engineering and modern web applications. We spent the day meeting attendees, answering questions, demoing products and collecting feedback from developers building everything from internal dashboards to customer-facing analytics platforms.
After hundreds of conversations, a few themes stood out.
The conversations weren’t really about React
Going into a React conference, we expected most discussions to revolve around React integrations, component APIs and framework-specific questions. After all, we were at React Summit.
Instead, many attendees simply assumed Highcharts would work with React, so conversations quickly moved beyond Highcharts React itself and focused on the problems developers were trying to solve, especially in terms of accessibility, data grids and data import/export.
That was a useful reminder that developers ultimately care less about what frameworks our products support and more about what they can build with them.
Accessibility is now part of the conversation
Accessibility was one of the most common topics at our booth.
Not long ago, accessibility discussions often happened late in a project, after core functionality had already been built. Increasingly, teams are evaluating accessibility requirements from the start and considering them alongside performance, maintainability and user experience.
For developers building data-heavy applications, accessible data visualization is becoming an expected capability rather than a nice-to-have feature.
Developers are thinking beyond charts
One of the most surprising topics of discussion was Highcharts Grid.
Many attendees weren’t looking for a charting library alone. They were building complete analytics experiences that combine charts, tables, dashboards and data exploration tools. It reinforced something we’ve been seeing across the industry: modern analytics applications increasingly rely on charts and data grids working together as part of a single interface.
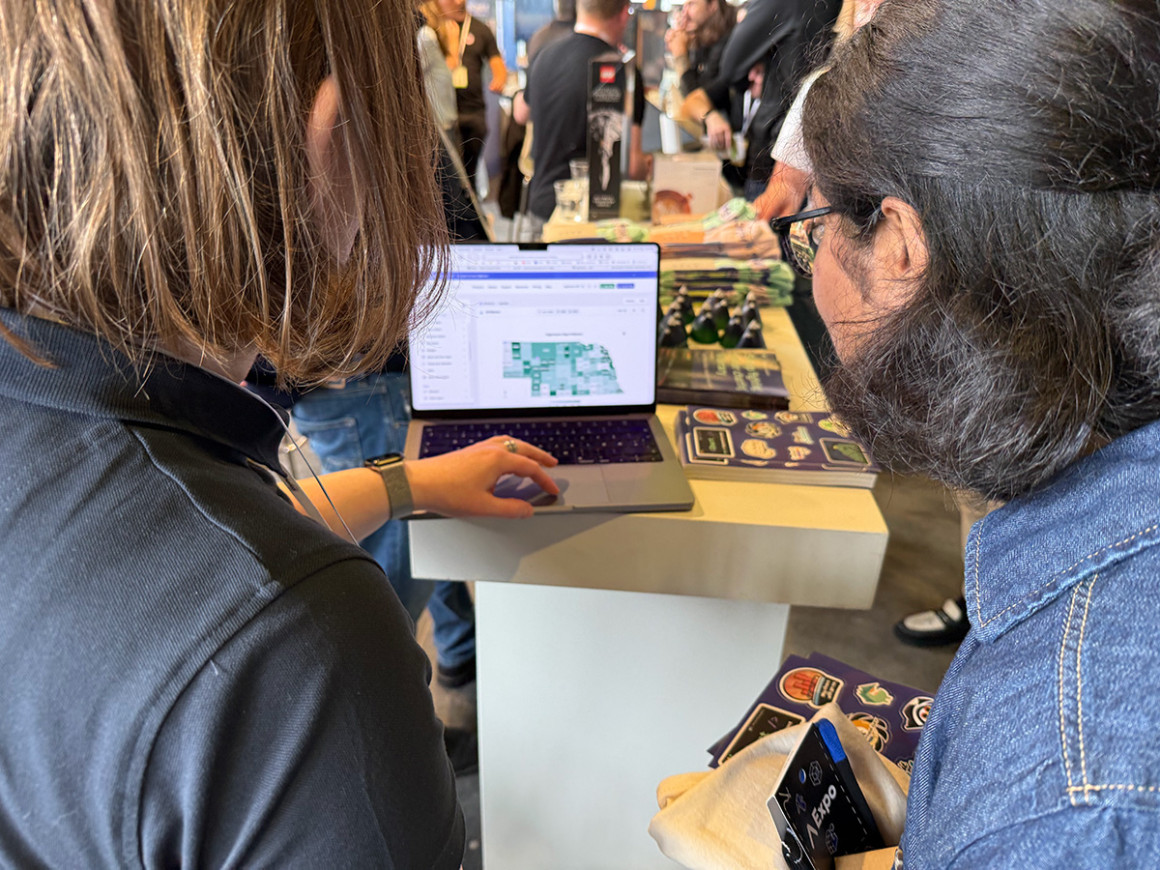
Showing beats telling
We spent much of the day showing products in action, and the response was immediate. Attendees who weren’t initially interested in a particular feature often became engaged once they could see it working. Interactive maps, animated charts and live dashboards consistently sparked questions, ideas and discussions about real-world use cases.
The experience reinforced the importance of showing software, not just describing it. A developer may not walk up to a booth looking for a mapping solution, but seeing an interactive globe or a dashboard update in real time can quickly change the conversation.
It also gave us ideas for improving our demos. Attendees repeatedly gravitated toward visual, interactive examples and requested even more animation and richer map-based experiences. As we continue refining our conference demos, we’ll be looking for new ways to make the capabilities of our products immediately visible and easy to explore.
Developers still want to talk to developers
One of our favorite parts of the event was the quality of the conversations.
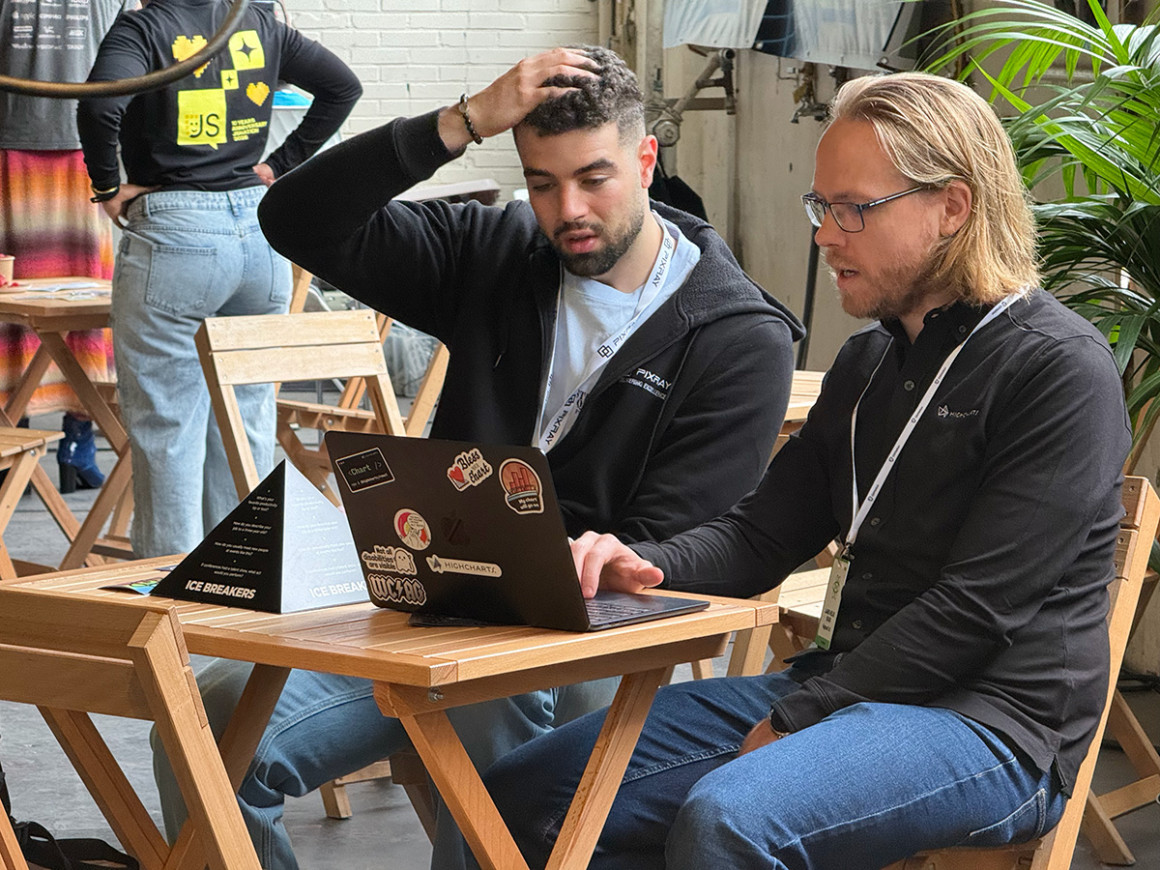
Unlike some larger conferences where attendees may be browsing casually, many of the people who stopped by our booth were actively building applications and evaluating solutions. Some were existing users looking to learn more. Others had feature requests or implementation questions. A surprising number simply stopped by to say thank you and share how they’re using Highcharts in their projects.
Those conversations are invaluable because they provide a direct window into the challenges developers are facing today.
Some of the feature requests and ideas we heard included improved support for React child components inside charts, lazy-loading columns in Grid, additional legend styling options and support for importing more data formats.
Looking ahead
We came to Amsterdam expecting to talk about React. We left with a clearer picture of what developers are building in 2026: accessible, data-heavy applications that combine charts, grids, maps and analytics into a single experience.
Thank you to everyone who stopped by the booth, shared feedback, requested features, asked questions or simply introduced themselves. We learned a lot, and we’re already looking forward to the next opportunity to continue the conversation.


Leave a Reply