Calendars are well-suited for planning and managing events, but they do not always provide a specific overview of workload or activity levels. By adding purpose-built components to a calendar, we can gain insights that otherwise would have been hard to detect.
Enter the Bryntum Calendar. This JavaScript-based web component offers high-performance calendar views out of the box. It also allows you to add your own custom components to tailor the calendar to your needs.
In this article, we’ll take a look at how the Bryntum Calendar can integrate with Highcharts to create a dynamic calendar that visualises data. For a technical step-by-step tutorial, check out this blog post on the Bryntum website.
While this demo uses vanilla JavaScript, both Bryntum and Highcharts provide official integrations for React, Angular, and Vue. This makes makes it easy to apply the same pattern in modern application stacks.
Extending the calendar with Highcharts
On its own, an interactive calendar component is a useful tool for scheduling. But, what if you want to know which day of the week is busiest? Or, how many events a specific team member has planned for today? This is where Highcharts comes in. By creating a custom Highcharts component, you can combine the Bryntum Calendar with an interactive column chart that updates automatically as users navigate between different time periods. Now, you have immediate insight into the selected calendar view.
To view the final result, check out the Calendar with Highcharts demo on the Bryntum website.
What is the Highcharts + Bryntum Calendar integration?
Since Bryntum calendars allow you to add custom components, we can integrate a calendar with a Highcharts component using JavaScript. In other words, we can embed a Highcharts chart as an additional view to the calendar.
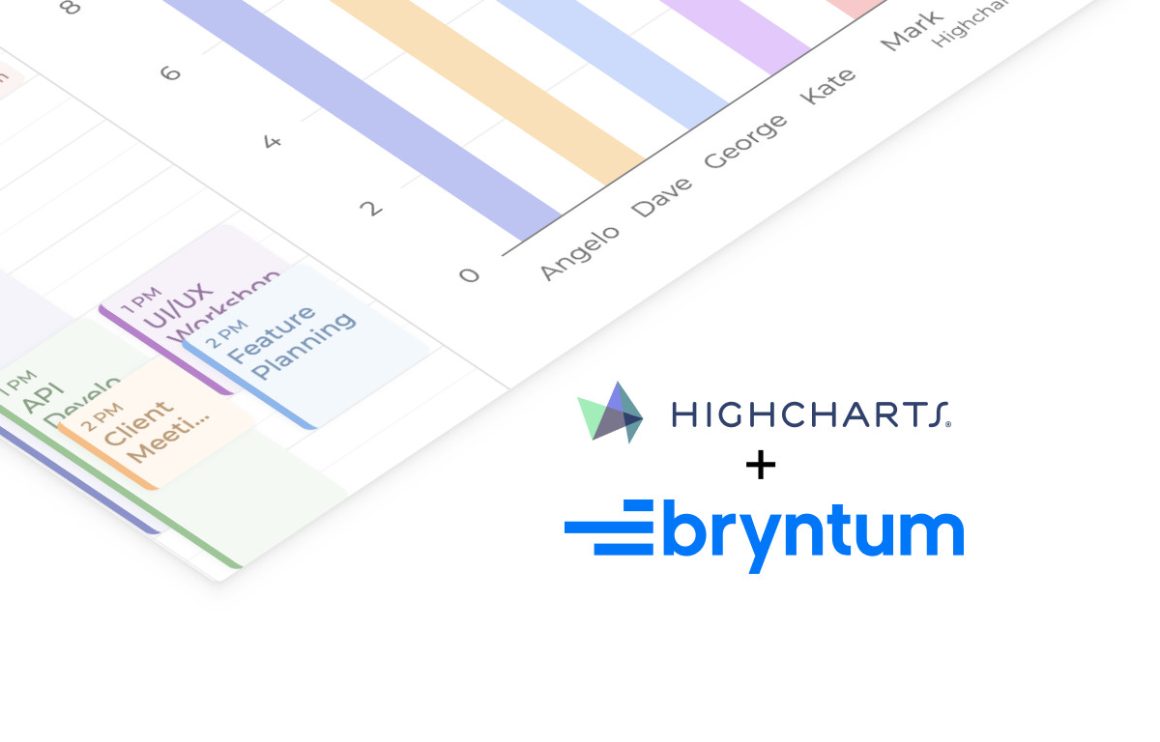
In the demo, a Highcharts column chart is rendered next to a calendar and kept in sync with the active date range and selected dataset. The chart aggregates events either per day or per resource, giving a quick analytical overview of the currently visible period.
The “Events per day” view highlights how busy days are across resources, while the “Events per resource” view shows the number of events each person has within the chosen time frame.
How it’s done
Extending the Bryntum Calendar with Highcharts creates a chart component that reacts to calendar state and re-renders based on the active calendar view.
The integration follows these core steps:
- Create a custom component class that extends Bryntum’s Widget class and wraps a Highcharts chart instance, including methods for rendering and updating the chart.
- Set up the main container and configure both the calendar component and the chart panel so they live side by side.
- Listen to calendar navigation changes, data updates, and filtering actions to determine the active time window and trigger chart updates
- Aggregate event data per day or per resource based on the selected dataset.
- Update the chart configuration, triggering
chart.update()to refresh the chart in real time as users navigate or filter. - Link Highcharts CSS variables to Bryntum CSS variables to ensure seamless light and dark theme switching.
- Import the exporting, export-data, and accessibility modules to enable chart downloads, data export, and inclusive navigation.
Combined, these steps create a tightly integrated experience where the chart acts as a live analytical layer on top of the calendar.
What Highcharts adds to the solution
Accessibility and inclusive data representation: Highcharts is built with accessibility in mind, helping you create visualizations that are usable by everyone. Beyond the built-in features that come with the accessibility module, the Highcharts + Bryntum integration includes context-aware descriptions for screen readers via the accessibility.description option to ensure screen readers accurately convey both chart views. Combined with keyboard navigation and the optional data table view, this ensures calendar analytics remain accessible.
Customizable and rich tooltips: By utilizing the useHTML: true option in the Highcharts tooltip configuration, we create fully customized tooltips with dynamic content including resource avatars, calculated totals and event previews. This interactivity adds another exploratory layer to the chart columns.
Seamless theme and style integration: Highcharts is highly adaptable to its environment. In the Bryntum integration, we bridge the styling gap between Highcharts and Bryntum by linking relevant Highcharts CSS variables to corresponding Bryntum CSS variables. This conveniently ensures that the chart theme updates along with the Bryntum theme when switching between dark and light mode.
Exporting: With the exporting and export-data modules enabled, users can print charts or download them as PNG, JPEG, PDF, or SVG. They can also view the underlying data as HTML or download it as CSV or XLS, making it easy to reuse calendar analytics in reporting workflows.
Performance and scalability: Highcharts is optimized for performance. It ensures smooth rendering and updates even when visualizing large datasets. This makes it a reliable analytics layer for data-intensive calendar applications.
Framework flexibility: Like the Bryntum Calendar, Highcharts works consistently across vanilla JavaScript, React, Angular, and Vue. This makes it straightforward to integrate into Bryntum applications regardless of your chosen frontend framework.
Summary
By extending the Bryntum Calendar with a custom Highcharts component, your calendar becomes more than a planning tool. You gain clear, interactive analytics that update in real time as users navigate dates and switch perspectives. With built-in accessibility, rich interactivity, seamless theming, strong performance, and flexible exporting options, Highcharts turns calendar data into actionable insight without disrupting the user experience.
What insights could you unlock in your own calendar app by using Highcharts?


Leave a Reply