Building a chart that responds to data changes is a useful tool to know. In this post, I will show you how to connect @highcharts/react to React state so your chart updates automatically with no manual refresh, no chart.update() call, just React doing what it does best.
What you will build
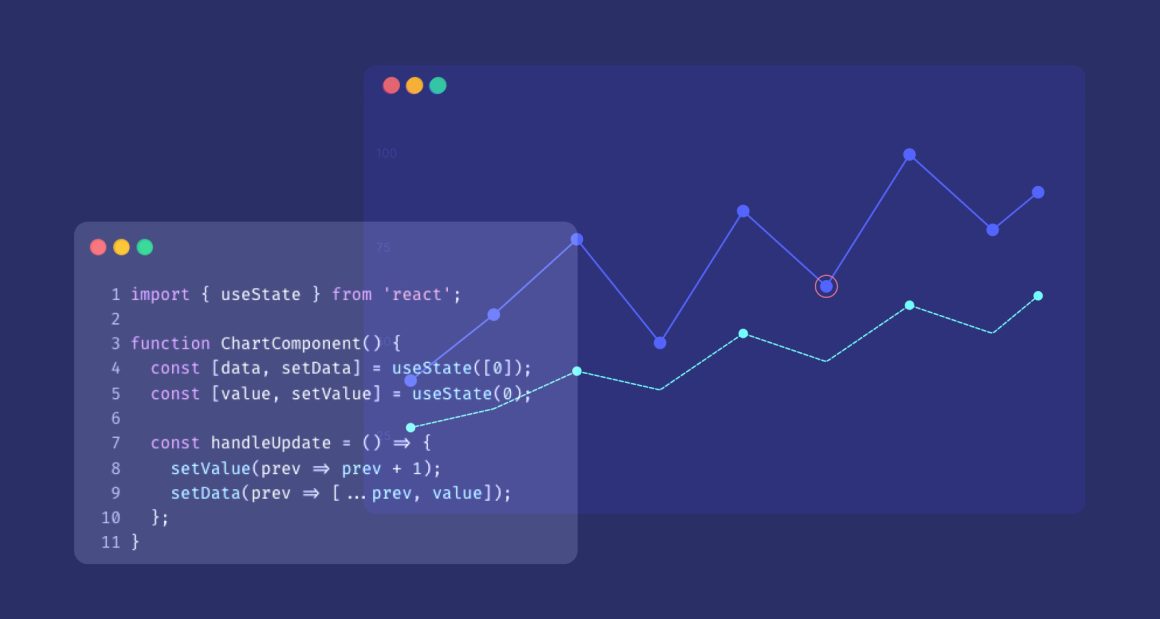
A line chart that updates instantly when the underlying data changes. Simple, clean, and the foundation for every real dashboard you will ever build.
Prerequisites
- Node.js installed (
node -vto check) - Basic knowledge of React
Setting up the project
Create a folder, then create a new React project using Vite:
npm create vite@latest . -- --template reactInstall Highcharts:
npm install @highcharts/reactStart the dev server:
npm run devThen open http://localhost:5173 in yout browser.
Your first chart
Open src/App.jsx, delete everything inside and replace it with:
import { Chart } from '@highcharts/react'
import { LineSeries } from '@highcharts/react/series/Line'

function App() {
  return (
    <Chart>
      <LineSeries data={[3, 4, 1, 5, 2]} />
    </Chart>
  )
}
export default AppSave the file. You should see a line chart in your browser.
Adding useState
Static data is a good start. But real dashboards have dynamic data, filters, user interactions, API responses. This is where useState comes in.
useState gives your component memory. When the data changes, React re-renders the component and the chart reflects the new data automatically.
Update App.jsx:
import { useState } from 'react'
import { Chart } from '@highcharts/react'
import { LineSeries } from '@highcharts/react/series/Line'

function App() {
 const [data, setData] = useState([3, 4, 1, 5, 2])
 function updateData() {
   setData([5, 2, 8, 1, 6])
 }
 return (
   <>
     <button onClick={updateData}>Update Chart</button>
     <Chart>
       <LineSeries data={data} />
     </Chart>
   </>
 )
}
export default AppClick the button. The chart updates instantly.
What just happened
Three things worth understanding:
1. useState initialises the data
const [data, setData] = useState([3, 4, 1, 5, 2])data holds the current value. setData updates it. Every time setData is called, React re-renders the component.
2. The chart receives data as a prop
<LineSeries data={data} />data is just a prop. When it changes, @highcharts/react handles the update internally, no manual intervention needed.
3. Don’t call chart.update() manually If you have used Highcharts before, chart.update() is still there, it happens behind the scenes every time your state changes. The integration is smart enough to call it at the right moment with the right options.
What you should not do is call chart.update() manually. If you do, your React state and your chart will get out of sync, two sources of truth, neither reliable. Let the integration handle it. Update your state, and @highcharts/react takes care of the rest.
Why this matters
This is the pattern behind every dashboard filter, every date range picker, every data refresh button. The chart is not a special case in your component tree, it is just another React component that responds to state like everything else.In the next post, we will fetch real data from an API using useEffect and pass it through the same pattern.


Leave a Reply