highcharts for
Accessibility
We offer an accessible interactive chart solution to empower people with disabilities. Explore our Accessibility portal for features, resources, tutorials, and use cases.
Insights and Innovations in Accessible Data Viz


Explore Highcharts Accessibility Features
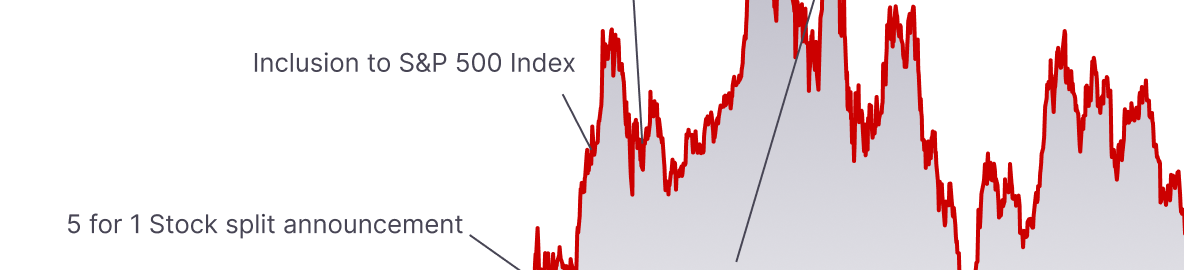
Keyboard Navigation
An essential part of the Highcharts Accessibility module is keyboard navigation support. By including the module with your charts, users can navigate and interact with chart by keyboard only.
Screen Readers
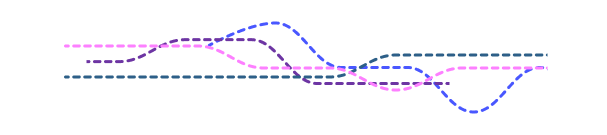
With the Highcharts Sonification module enabled, you can turn data into sound. This can be highly effective for conveying trends and patterns quickly without the need for visuals.
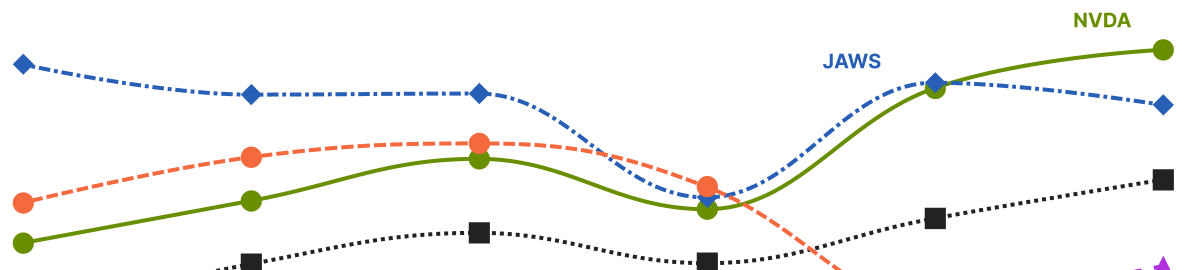
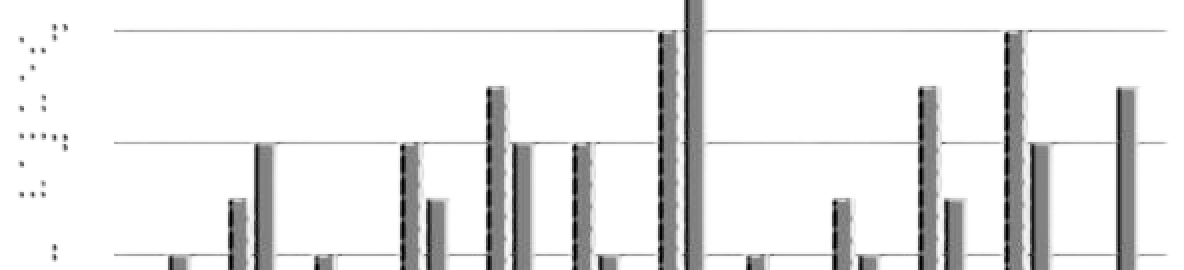
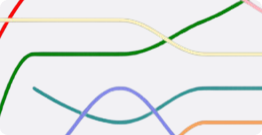
Low Vision Features
Highcharts comes with built-in support for Windows High Contrast Mode. We also offer pre-made pattern fills and higher contrast themes. You can also create your own themes and style all visual elements in the chart.
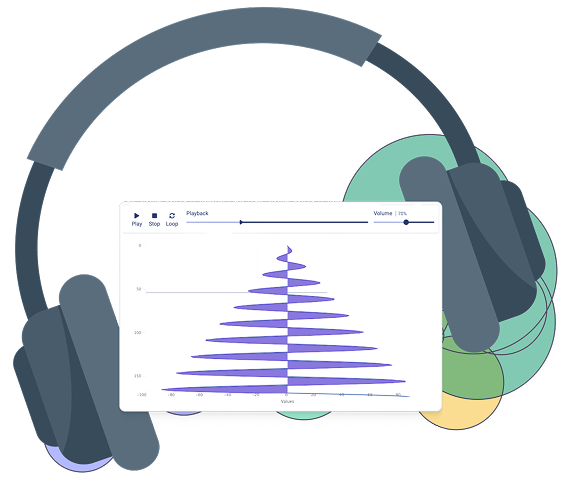
Audio Charts
With the Highcharts Sonification module enabled, you can turn data into sound. This can be highly effective for conveying trends and patterns quickly without the need for visuals.
Additional features

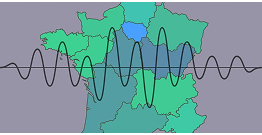
Highcharts Sonification Studio
Designed in collaboration with
Highcharts has teamed up with the Sonification Lab at Georgia Institute of Technology to bring you a free tool for exploring charts and sonification – using sound to visualize data.
Additional Resources
Articles
Dig deeper into the “why” of accessibility with articles that explore business value, user experience, compliance, and industry laws.


Tutorials
Get hands-on with step-by-step guides that show you how to make charts more accessible.

Use Cases
See how organizations around the world use Highcharts to solve real accessibility challenges.