
Guest post by Brandon Biggs
CEO, XR Navigation
Brandon is CEO of XR Navigation, an official Esri partner working in partnership with the National Federation of the Blind.
Maps tell stories that tables cannot. A choropleth of GDP per capita or world population lets a reader see a pattern at a glance. But “at a glance” is exactly the barrier for blind and low-vision (BLVI) people. Highcharts has treated accessibility as part of the product for years, from keyboard-navigable charts to screen reader support and its Accessibility module. Maps, though, have always been the harder problem. So we teamed up with the Highcharts team to bring Audiom directly to Highcharts Maps.
The barrier with data maps
Highcharts Maps powers thousands of dashboards, news graphics, and analytics products around the world. Its Accessibility module already lets screen reader users move through chart data point by point. For a map, though, reading a list of regions and values leaves out the information that makes a map a map: the spatial relationships. Which countries border which. What sits north of what. How a high-value cluster presses up against a low-value one. That spatial layer, what cartographers call landmark, route, and survey knowledge, is hard to convey through a plain data table.
This barrier is bigger than most developers realize. An estimated 1.6 billion people, around 20% of the world, cannot use digital maps: blind and low-vision people, keyboard-only users who navigate without a mouse, and many others. They all deserve an “equivalent purpose” experience, the standard set out in the Web Content Accessibility Guidelines (WCAG) 1.1.1. The law increasingly agrees. In the United States, ADA Title II now requires state and local government websites and apps, including their maps, to be WCAG 2.1 AA compliant. Delivering that for an interactive map takes purpose-built technology.
What Audiom does
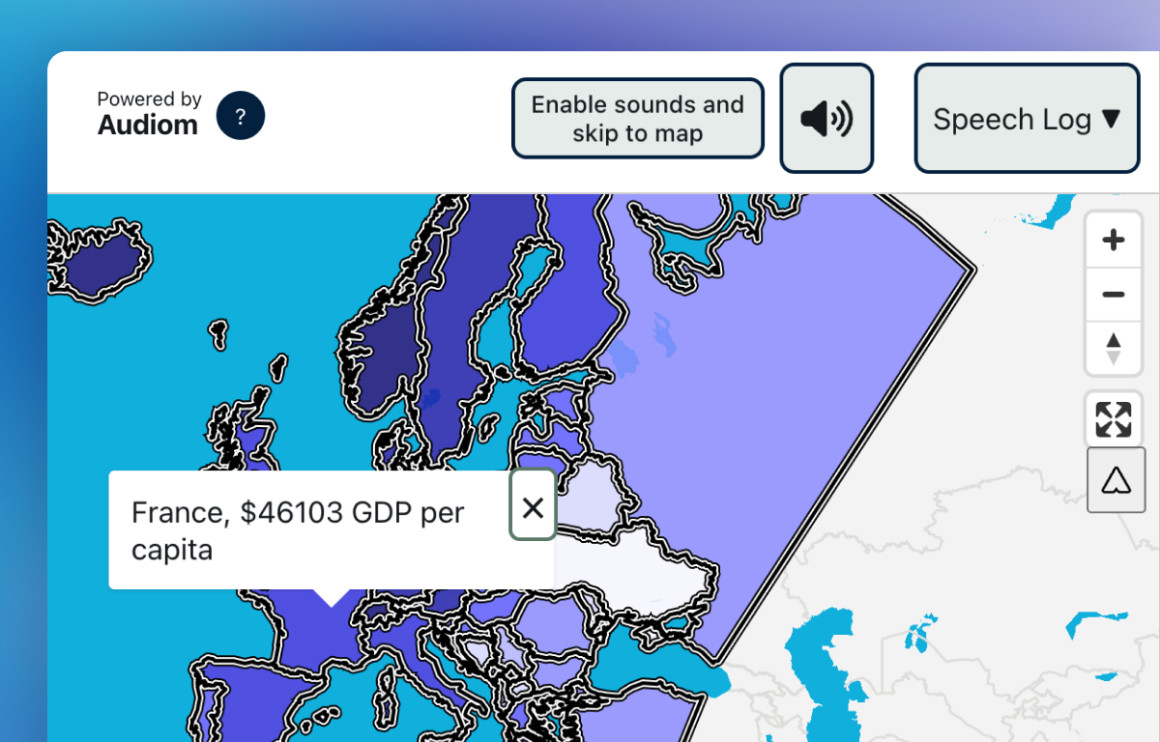
Audiom is our inclusive digital map viewer and editor. Currently all executives and board members of XR Navigation have a disability. A blind user can explore an Audiom map with a keyboard or a touch screen, hear each region announced with its name and value, move between neighbors, and build a mental model of the whole layout through interactive alt-text and audio.
Audiom is not a lightweight add-on. It is WCAG AAA compliant with a 3rd-party Accessibility Conformance Report, it is grounded in over 13 academic studies with hundreds of blind and sighted participants, and it was one of three recipients of the 2025 Global Accessibility Awareness Day (GAADY) award. In 2024, the National Federation of the Blind passed a resolution calling on federal agencies and universities to adopt inclusive digital maps. We built Audiom to meet that call.
How the integration works
Our Audiom-Highcharts plugin does the work for you. When your Highcharts map loads, the plugin reads the map’s GeoJSON and mounts an interactive Audiom experience alongside it. Your visual chart stays exactly as you designed it. Sighted and BLVI users get the same underlying data, each in the form that works for them.
You decide how the two experiences sit together with a single display option:
- Tabbed (the default): the Highcharts map on tab one, the Audiom map on tab two.
- Side-by-side: both experiences visible at once in a flexible layout.
- Button: a link-only mode for environments that restrict iframes.
Because the plugin works from the same geographic data your chart already uses, there is no separate map to build or maintain. Update your Highcharts data and the accessible experience updates with it.
See it in action
We have two live demos you can try today. Move through the visual chart, then switch to the Audiom tab and explore the same map with your keyboard or screen reader:
- Europe: GDP per capita, a choropleth of 2023 GDP per capita across European countries.
- World population, a choropleth of 2022 population by country.
Both are on our Audiom-Highcharts samples page. Each demo also exposes the underlying GeoJSON and the Audiom rules file, so you can see what data drives the accessible view.
Adding it to your own maps
Getting started takes only a few lines. The @xrnavigation packages are published to GitHub Packages, so first add the registry to your .npmrc:
@xrnavigation:registry=https://npm.pkg.github.com
//npm.pkg.github.com/:_authToken=${GITHUB_TOKEN}Then install the plugin packages alongside Highcharts:
npm install @xrnavigation/audiom-highcharts \
            @xrnavigation/audiom-embedder \
            @xrnavigation/audiom-api-client \
highchartsInitialize the plugin with your Audiom API key, choose a storage backend for the map’s GeoJSON, and build your map chart as you normally would:
import * as Highcharts from 'highcharts/highmaps';
import AudiomPlugin, { SourceBackend } from '@xrnavigation/audiom-highcharts';

AudiomPlugin.init(Highcharts, {
  apiKey: import.meta.env.VITE_AUDIOM_API_KEY,
  backend: SourceBackend.inline()   // pick one, see "Backends"
});

Highcharts.mapChart('chart-container', {
  chart: { map: 'custom/world' },
  title: { text: 'World population' },
  series: [{ type: 'map', data: [/* … */] }]
});Our full plugin README covers configuration in detail, including several storage backends for your GeoJSON (self-hosted URLs, a REST endpoint, S3, or direct upload to the Audiom cloud) and per-chart customization through the chart’s audiom options.
What is next
This is version 0.1. We are already working on support for map bubble charts and on matching Audiom’s projection and zoom to the Highcharts rendering even more closely.
Your dashboard should work for every person who opens it, and now that includes the map. Please contact us to get your Audiom API key and to talk about making your Highcharts maps accessible.







Leave a Reply