We’re heading back to the 41st Annual CSUN Assistive Technology Conference with the next step in our accessibility work.
At 2025’s conference, we focused on how different levels of chart complexity require different interaction models. This year, we’re building on that work by introducing AI-assisted chart exploration.
Looking Back at CSUN 2025
Last year, we held sessions exploring how chart complexity shapes accessibility.
For example, a straightforward bar chart should be immediately understandable through keyboard navigation and screen readers. But a dense network graph with hundreds of nodes requires structured exploration tools and more advanced navigation controls.
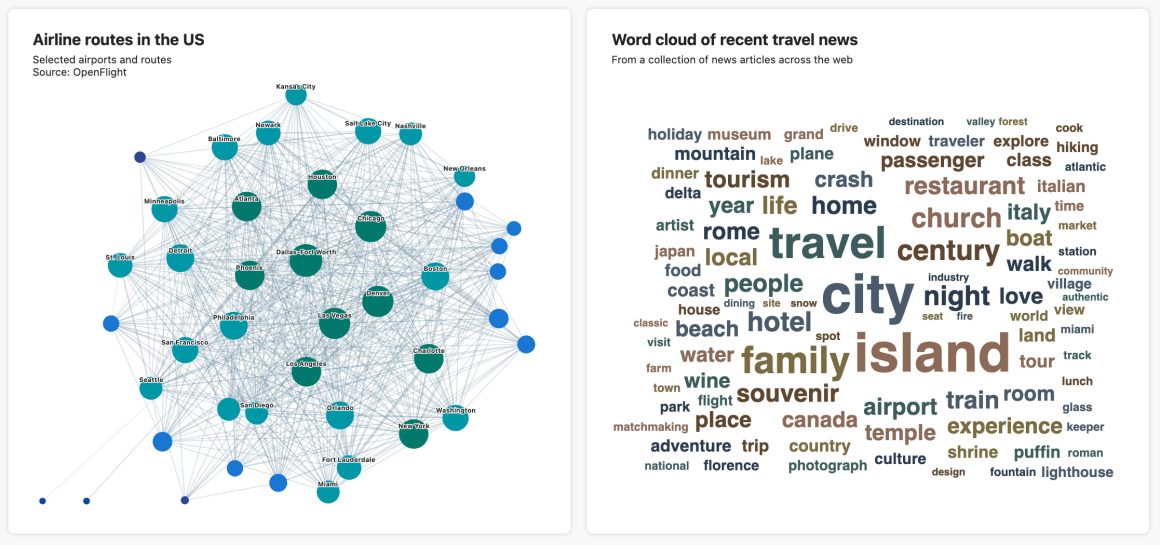
Highcharts accessibility demos from CSUN 2025
In other words, different charts demand different interaction models. The response from CSUN 2025 goers was strong and sparked some deep conversations.
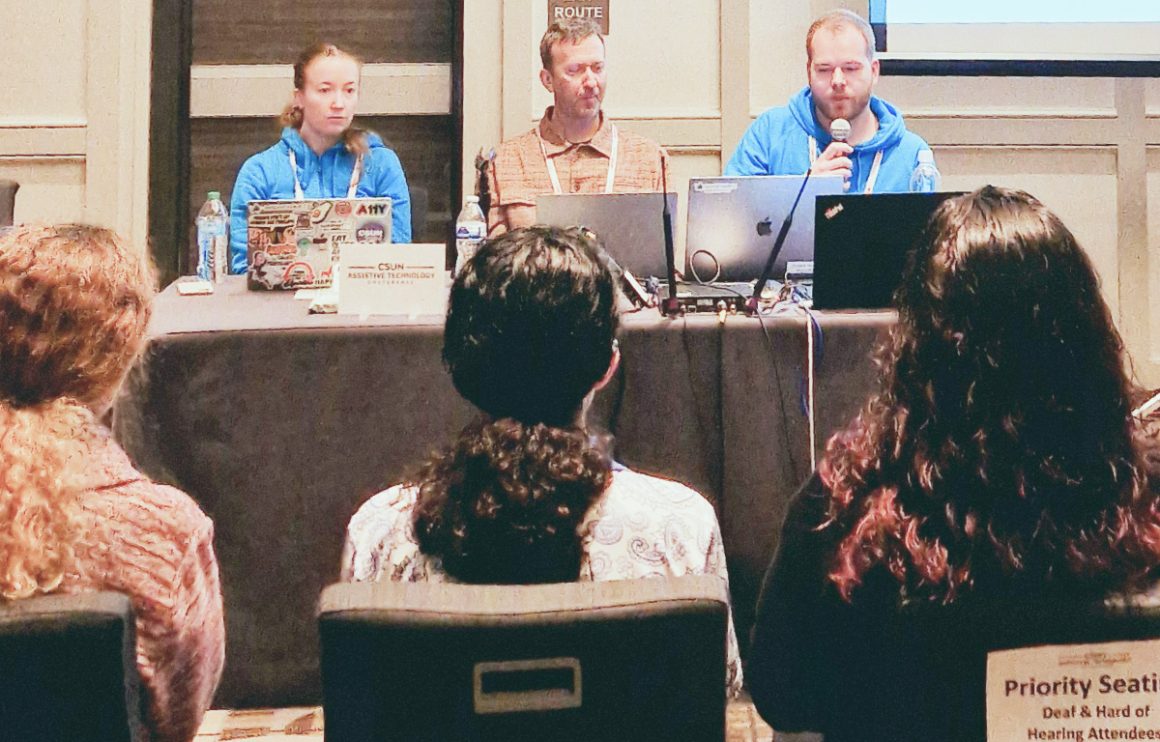
At our booth, attendees were wowed by our sonification demos and how data can be experienced through sound. (One person described it as “mind blowing.”)
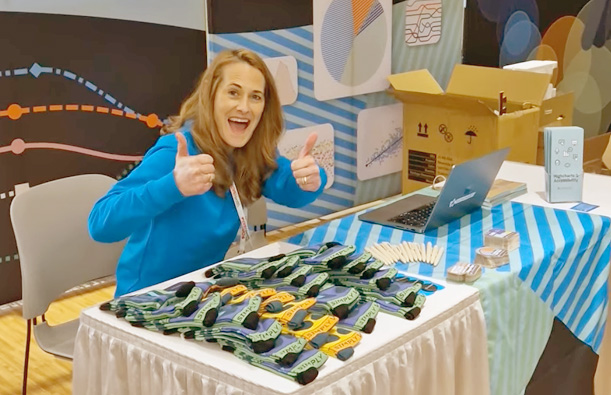
And yes, our “ugly” socks and Norwegian chocolate helped draw a crowd. But what kept people engaged were the conversations about how Highcharts makes data meaningful for everyone.
What We’re Bringing to CSUN 2026
This year, we’re showcasing demos that allow users to ask charts direct questions about the underlying data through an AI-assisted interface. The goal is not to replace traditional navigation, but to provide another way to explore. Instead of relying solely on structured keyboard controls or predefined chart tools, users can hone in on trends, outliers, or relationships through targeted queries.
In this way, AI becomes an additional layer of investigation that helps users focus on what matters most in the data and shorten the path from interaction to understanding.
That said, AI is not a substitute for strong accessibility foundations.
Accessible charts still require structured semantics, robust keyboard navigation, screen reader support, and thoughtful interaction design. These remain core to Highcharts and are not being replaced. Our exploration with AI is about enhancement, not substitution.
We also recognize that AI-generated responses require human judgment. This work is still experimental, and responsible integration means validating outputs and understanding limitations.
At CSUN 2026, we’re sharing what we’ve built so far and inviting discussion about where AI can meaningfully support accessible chart exploration, as well as where it cannot.
See It in Action
At our booth, we’ll be sharing demos from our accessibility demo hub, including interactive examples for screen readers, keyboard users, sonification and now AI-assisted exploration.
You can preview some of our accessibility work at https://a11y-demos.highsoftlabs.com.
Or better yet, come see us live.
Booth #1113
We’ll be at booth #1113 from March 9–13, 2026 at the Anaheim Marriott in California.
Yes, the socks are back, and the chocolates too, along with some other surprises.
And yes, we’ll have live demos running all week.
If you’re working with data and care about accessibility, we’d love to talk.
See you at CSUN 2026.


Leave a Reply