Leah
Posts: 19
Joined: Thu Sep 08, 2022 11:53 am

Angular & X-range series

Hello, I'm trying to implement your example X-range series chart https://www.highcharts.com/demo/x-range in my Angular 13 project but I cannot get it to build, I get the follow errors:
Property 'yCategory' does not exist on type 'Point'. Did you mean 'category'?
Type 'number' has no properties in common with type 'XrangePointPartialFillOptionsObject'

What interface should I use for options?

Here is the code I'm using:

Code: Select all

import { Component } from '@angular/core';
import * as Highcharts from 'highcharts';
import XRange from 'highcharts/modules/xrange';

XRange(Highcharts);

@Component({
    selector: 'report-chart-result-timeline-highcharts',
    template: '<highcharts-chart style="width: 100%; display: block;" [options]="options" [Highcharts]="Highcharts"></highcharts-chart>'
})

export class TimelineHighchartsComponent {

    Highcharts: typeof Highcharts = Highcharts;
    options: Highcharts.Options = {
        chart: {
            type: 'xrange',
            height: 500,
        },
        title: {
            text: 'Highcharts X-range'
        },
        accessibility: {
            point: {
                descriptionFormatter: function (point) {
                    var ix = point.index + 1,
                        category = point.yCategory,
                        from = new Date(point.x),
                        to = new Date(point.x2);
                    return ix + '. ' + category + ', ' + from.toDateString() +
                        ' to ' + to.toDateString() + '.';
                }
            }
        },
        xAxis: {
            type: 'datetime'
        },
        yAxis: {
            title: {
                text: ''
            },
            categories: ['Prototyping', 'Development', 'Testing'],
            reversed: true
        },
        series: [{
            name: 'Project 1',
            // pointPadding: 0,
            // groupPadding: 0,
            borderColor: 'gray',
            pointWidth: 20,
            data: [{
                x: Date.UTC(2014, 10, 21),
                x2: Date.UTC(2014, 11, 2),
                y: 0,
                partialFill: 0.25
            }, {
                x: Date.UTC(2014, 11, 2),
                x2: Date.UTC(2014, 11, 5),
                y: 1
            }, {
                x: Date.UTC(2014, 11, 8),
                x2: Date.UTC(2014, 11, 9),
                y: 2
            }, {
                x: Date.UTC(2014, 11, 9),
                x2: Date.UTC(2014, 11, 19),
                y: 1
            }, {
                x: Date.UTC(2014, 11, 10),
                x2: Date.UTC(2014, 11, 23),
                y: 2
            }],
            dataLabels: {
                enabled: true
            }
        }]
    };
}
hubert.k
Posts: 1164
Joined: Mon Apr 11, 2022 11:48 am

Re: Angular & X-range series

Hi Leah!
Thanks for contacting us with your question!

As you mentioned, all you have to add is some properties to interfaces, because some of our internal properties that are not publicly available. You can check the working online demo below to see examples of interfaces.

Demo: https://stackblitz.com/edit/highcharts- ... ine-n2zwv8
API Reference: https://github.com/highcharts/highchart ... n-type-yyy

Feel free to ask any further questions.
Regards!
Hubert Kozik
Highcharts Developer
Leah
Posts: 19
Joined: Thu Sep 08, 2022 11:53 am

Re: Angular & X-range series

Thank you that worked.

We're currently evaluating highcharts to decide if we're going to switch over. I'm trying to recreate a google chart we've previously had:

Image

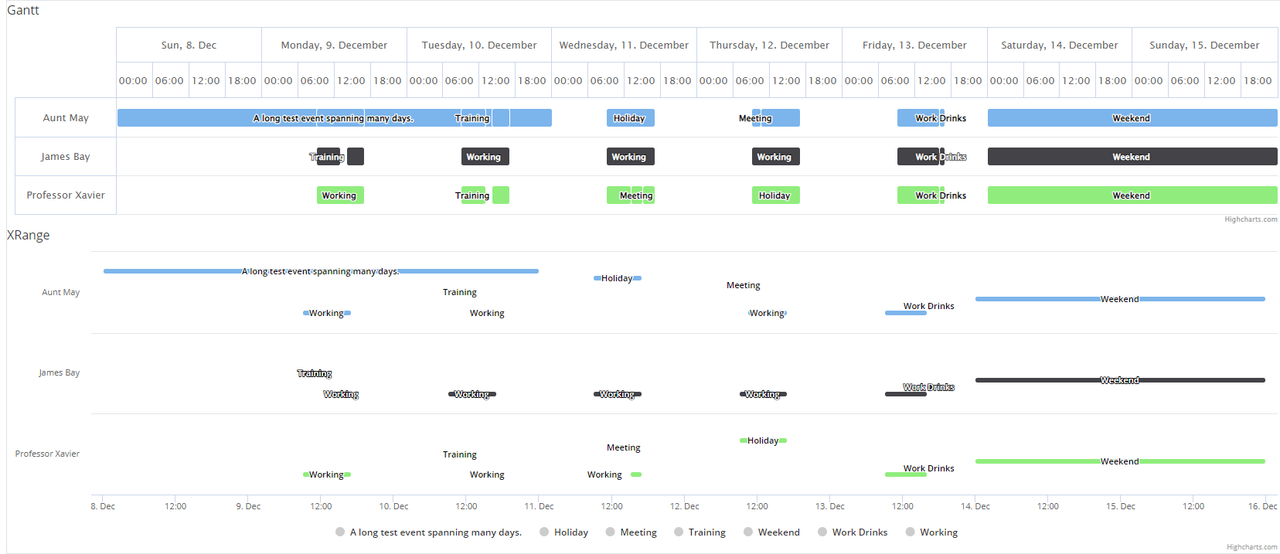
I have tried using xrange and a gantt chart but I can't quiet get the outcome I'd like:

Image

The gantt chart is overlapping points, is it possible to prevent this? The xrange is doing the opposite and giving loads of white space?

Is there a way to get it to colour the points per series, instead of per category? So for example I could make every point for the series holiday green?

On the gantt chart can I define the time slots shown, for example I might want to show 9 am to 1pm, and 1 pm to 5 pm as two time blocks under a date?

Thanks
hubert.k
Posts: 1164
Joined: Mon Apr 11, 2022 11:48 am

Re: Angular & X-range series

Leah,
I have prepared a demo based on your actual chart. Actually, everything you want to achieve is possible to create in Highcharts, but it depends on how much work you want to spend on creating a feature. I didn't position dataLabels, because it will need some more calculations and sadly, I don't have so much time. To create the first row higher than the others it is needed a custom code with the translation of points on chart load event and some yAxis.breaks. The rest is basically setting the data to the proper format. The demo is prepared in pure JS, to make it easier and show only chart configuration. If you need in in Angular, let me know.

Demo: https://jsfiddle.net/BlackLabel/7fpoecbr/

Let me know if you have any further questions.
Regards!
Hubert Kozik
Highcharts Developer

Return to “Highcharts Usage”