I would like to adjust the ticks on a negative logarithmic chart.
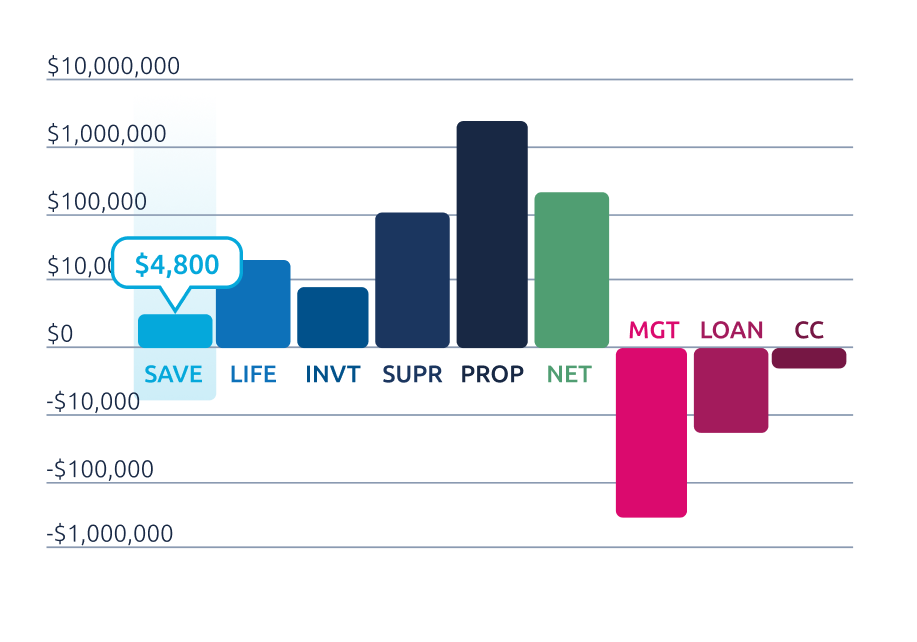
I would like the range to match more closely to the data. Currently it is displaying 0, 10, 100, 1000. Given the data 10 and 100 are not required.
Essentially could the range start at 1000 in both the positive and negative ranges?
I have used the following option but no no avail.
tickPixelInterval
tickInterval
minRange
min
max
tickAmount
alignTicks
endOnTick
startOnTick
tickPositioner
Is there a solution?
Fiddle: https://jsfiddle.net/bobjwatts/8ac17egt/30/