ianrush
Posts: 3
Joined: Thu Aug 04, 2022 7:28 am

Combine line and area show strange when it has too many data

Hello everyone,

I tried to make this similar to the result image but it show strange, it's too narrow and the volume chart (blue area) is very near to the index chart.
The axsis is 1 hour interval is fixed from 9:00 to 15:00, break from 11:30 to 13:00 and data is 1 minute interval with {time, index, volume}.
Do you have any ideas?

Thanks for your help.

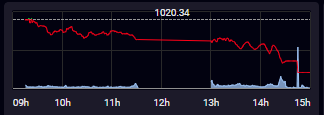
This is what I want: Image
This is my code: https://codesandbox.io/s/highcharts-sto ... /Chart2.js
User avatar
dawid.d
Posts: 835
Joined: Thu Oct 06, 2022 11:31 am

Re: Combine line and area show strange when it has too many data

Hi,

Welcome to our forum and thanks for contacting us with your question!

Instead of using the column type for the 'volume' series, you can use the area type.

Both series are very close to each other as they have similar values. If you generate smaller data for the area series, the chart will be more similar to the one shown in the image provided.

Demo: https://jsfiddle.net/BlackLabel/wuae1f6m/

If you cannot change the data, you can move the second series to the second y-axis and increase the maximum of that axis.

Let me know if that was what you were looking for!
Best regards!
Dawid Draguła
Highcharts Developer
ianrush
Posts: 3
Joined: Thu Aug 04, 2022 7:28 am

Re: Combine line and area show strange when it has too many data

dawid.d wrote: Tue Dec 27, 2022 5:12 pm Hi,

Welcome to our forum and thanks for contacting us with your question!

Instead of using the column type for the 'volume' series, you can use the area type.

Both series are very close to each other as they have similar values. If you generate smaller data for the area series, the chart will be more similar to the one shown in the image provided.

Demo: https://jsfiddle.net/BlackLabel/wuae1f6m/

If you cannot change the data, you can move the second series to the second y-axis and increase the maximum of that axis.

Let me know if that was what you were looking for!
Best regards!
Thank you, it looks better now. May I have one question ?
How can I show continue line despite break from 11:30 to 13:00 (remove the horizontal line between that time).
User avatar
dawid.d
Posts: 835
Joined: Thu Oct 06, 2022 11:31 am

Re: Combine line and area show strange when it has too many data

Hi,

You're welcome!

Do you mean plotline break during data break? You can achieve this by rendering your own two lines with a renderer.
See: https://api.highcharts.com/class-refere ... derer#path

Demo: https://jsfiddle.net/BlackLabel/93junqb2/

In case of any further questions, feel free to contact us again.
Best regards!
Dawid Draguła
Highcharts Developer

Return to “Highcharts Stock”