
If you are a .NET developers looking to add charts to your project, the new Highcharts and Highstock wrapper for .NET Standard library will be your best option. This wrapper works seamlessly in Xamarin, .NET Core and as well as the .NET Framework. Best of all; no Javascript involved.
If this is the first time you are using the Highcharts .NET wrapper, here is a quick tutorial on how to get started.
Your first chart with Highcharts .NET and .NET Core
There are five main steps to create a chart with Highcharts .NET and .NET Core
1. Create a project:
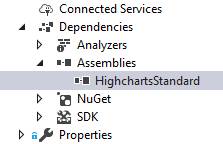
Create your project, then add a reference to HigchartsStandard.dll
2. Add data:
To define data, you can either pass it from the controller to the chart in the view or use fixed data in the view.
- A. Passing data from the controller to the chart view
This process would involve a database query, but for the sake of simplicity, fixed data is used.
Go to controller file and create aListwith values corresponding to the data you would like to display on the chart you need. If you are using other chart types, e.g.Areainstead ofLine, the collection becomesList. You can add any data to the collection and then set the ViewData for the respective item to the instance of the collection you need. This will later be used by the View and the chart itself to get the data, for example:public ActionResult ColumnBasic() { List<double> tokyoValues = new List<double> { 49.9, 71.5, 106.4, 129.2, 144.0, 176.0, 135.6, 148.5, 216.4, 194.1, 95.6, 54.4 }; List<double> nyValues = new List<double> { 83.6, 78.8, 98.5, 93.4, 106.0, 84.5, 105.0, 104.3, 91.2, 83.5, 106.6, 92.3 }; List<double> berlinValues = new List<double> { 42.4, 33.2, 34.5, 39.7, 52.6, 75.5, 57.4, 60.4, 47.6, 39.1, 46.8, 51.1 }; List<double> londonValues = new List<double> { 48.9, 38.8, 39.3, 41.4, 47.0, 48.3, 59.0, 59.6, 52.4, 65.2, 59.3, 51.2 }; List<ColumnSeriesData> tokyoData = new List<ColumnSeriesData>(); List<ColumnSeriesData> nyData = new List<ColumnSeriesData>(); List<ColumnSeriesData> berlinData = new List<ColumnSeriesData>(); List<ColumnSeriesData> londonData = new List<ColumnSeriesData>(); tokyoValues.ForEach(p => tokyoData.Add(new ColumnSeriesData { Y = p })); nyValues.ForEach(p => nyData.Add(new ColumnSeriesData { Y = p })); berlinValues.ForEach(p => berlinData.Add(new ColumnSeriesData { Y = p })); londonValues.ForEach(p => londonData.Add(new ColumnSeriesData { Y = p })); ViewData["tokyoData"] = tokyoData; ViewData["nyData"] = nyData; ViewData["berlinData"] = berlinData; ViewData["londonData"] = londonData; return View(); } - B. Use fixed data in the view
The method described above is the most common way to define data. Another way to define data is to create Highcharts object directly in the View, as shown here:Series = new List { new ColumnSeries { Name = "Brands", ColorByPoint = true, Data = new List { new ColumnSeriesData { Name = "Microsoft Internet Explorer", Y = 56.3, Drilldown = "Microsoft Internet Explorer" }, new ColumnSeriesData { Name = "Chrome", Y = 24.03, Drilldown = "Chrome" }, new ColumnSeriesData { Name = "Firefox", Y = 10.3, Drilldown = "Firefox" }, new ColumnSeriesData { Name = "Sfari", Y = 4.77, Drilldown = "Safari" }, new ColumnSeriesData { Name = "Opera", Y = 0.91, Drilldown = "Opera" }, new ColumnSeriesData { Name = "Proprietary or Undetectable", Y = 0.2, Drilldown = null } } } },
3. Include JavaScript files:
Go to the view file and add online reference:
...
<script src="https://code.highcharts.com/highcharts.js"></script>
...
Some of the advanced chart types and features in Highcharts are not defined in the main highcharts.js file, but are available as separate modules. Add these modules as needed, for your project. Available additional modules are as follows:
...
<script src="https://code.highcharts.com/highcharts-3d.js"></script>
<script src="https://code.highcharts.com/modules/data.js"></script>
<script src="https://code.highcharts.com/modules/heatmap.js"></script>
<script src="https://code.highcharts.com/highcharts-more.js"></script>
<script src="https://code.highcharts.com/modules/funnel.js"></script>
<script src="https://code.highcharts.com/exporting.js"></script>
<script src="https://code.highcharts.com/modules/treemap.js"></script>
<script src="https://code.highcharts.com/modules/drilldown.js"></script>
<script src="https://code.highcharts.com/modules/solid-gauge.js"></script>
...
4. Add references to your view file and define the chart in the view
To add a reference to the view file, copy and paste the following lines:
@using Highsoft.Web.Mvc.Charts
@using Highsoft.Web.Mvc.Charts.Rendering;
The chart can be defined anywhere inside the View’s HTML definition, based on your page layout. To define the chart, go to view file (cshtml) and copy/paste the following code:
<script src = "https://code.highcharts.com/highcharts.js"></script>
<script src = "https://code.highcharts.com/modules/exporting.js"></script>

@using Highsoft.Web.Mvc.Charts
@using Highsoft.Web.Mvc.Charts.Rendering

@ {
  var chartOptions = new Highcharts {
    Title = new Title {
        Text = "Monthly Average Rainfall"
      },
      Subtitle = new Subtitle {
        Text = "Source: WorldClimate.com"
      },

      XAxis = new List<XAxis> {
        new XAxis {
          Categories = new List <string> {"Jan","Feb","Mar","Apr","May","Jun","Jul","Aug","Sep","Oct","Nov","Dec"}
        }
      },
      YAxis = new List<YAxis> {
        new YAxis {
          Min = 0,
            Title = new YAxisTitle {
              Text = "Rainfall (mm)"
            }
        }
      },
      Tooltip = new Tooltip {
        HeaderFormat = "<span style='font-size:10px'>{point.key}</span><table style='font-size:12px'>",
          PointFormat = "<tr><td style='color:{series.color};padding:0'>{series.name}: </td><td style='padding:0'><b>{point.y:.1f} mm</b></td></tr>",
          FooterFormat = "</table>",
          Shared = true,
          UseHTML = true
      },
      PlotOptions = new PlotOptions {
        Column = new PlotOptionsColumn {
          PointPadding = 0.2,
            BorderWidth = 0
        }
      },
      Series = new List<Series> {
        new ColumnSeries {
          Name = "Tokyo",
            Data = @ViewData["tokyoData"] as List<ColumnSeriesData>
        },
        new ColumnSeries {
          Name = "New York",
            Data = @ViewData["nyData"] as List<ColumnSeriesData>
        },
        new ColumnSeries {
          Name = "Berlin",
            Data = @ViewData["berlinData"] as List< ColumnSeriesData>
        },
        new ColumnSeries {
          Name = "London",
            Data = @ViewData["londonData"] as List<ColumnSeriesData>
        }
      }
  };

  chartOptions.ID = "chart";
  var renderer = new HighchartsRenderer(chartOptions);
}

@Html.Raw(renderer.RenderHtml())
Here is an explanation of the code above:
- First create Highcharts object chartOptions with all the options inside.
- Define the ID of DIV using the
chartOptions.ID=chartswhere the chart should be rendered. - Create HighchartsRenderer object based on Highcharts options using this line of code
var renderer = new HighchartsRenderer(chartOptions); - Finally, render the entire chart using this line of code
@Html.Raw(renderer.RenderHtml());
5. The final result will look like the picture below

Well, that is it. Now, you know how to create an interactive chart using Highcharts .NET standard wrapper.
Comments
Nisar Ahmad | 3 years ago
Severity Code Description Project File Line Suppression State
Error Could not install package ‘DotNet.HighStock 3.1.0’. You are trying to install this package into a project that targets ‘.NETFramework,Version=v4.6.1’, but the package does not contain any assembly references or content files that are compatible with that framework. For more information, contact the package author.
Daniel | 3 years ago
Highsoft.Highstock and Highsoft.Highcharts are our official packages on NuGet.
Anil Sezer | 2 years ago
Hi Daniel!
Code you provided has two syntax errors. Also a bit more clarification about what does what could be great, or links to sources.
Errors:
1 – Invalid use of whitespace.
…
@ {
var chartOptions = new Highcharts {
…
Should be
@{
…
2 – These city ColumnSeries are cant be built like this.
…
new ColumnSeries {
Name = “Tokyo”,
Data = @ViewData[“tokyoData”] as List
},
…
They should be:
…
new ColumnSeries {
Name = “Tokyo”,
Data = (List)ViewData[“tokyoData”]
},
…
Thanks!
hf-nsoeker | 11 months ago
In the Code block that should be copy/pasted into the view there is a typo. The adress to the script should use https instead of http. Otherwise it would not allow to load the script in my case.
Mustapha Mekhatria | 11 months ago
Thx, fixed now 🙂
Want to leave a comment?
Comments are moderated. They will publish only if they add to the discussion in a constructive way. Please be polite.