
In my previous post, I showed you how to get started with the official Highcharts React wrapper.
In this tutorial, I will show you how to create a simple, interactive dashboard with Highcharts and the React wrapper. This article is suitable for developers at all levels. It will be a quick read for any experienced developer and provide help for those who are new to either React or Highcharts.
Remark
I use Create React App and the Visual Studio Code IDE to build this project; you can download the project from this Github link or from the Codesandbox. If needed, refer to the previous post for how to create a project from scratch.
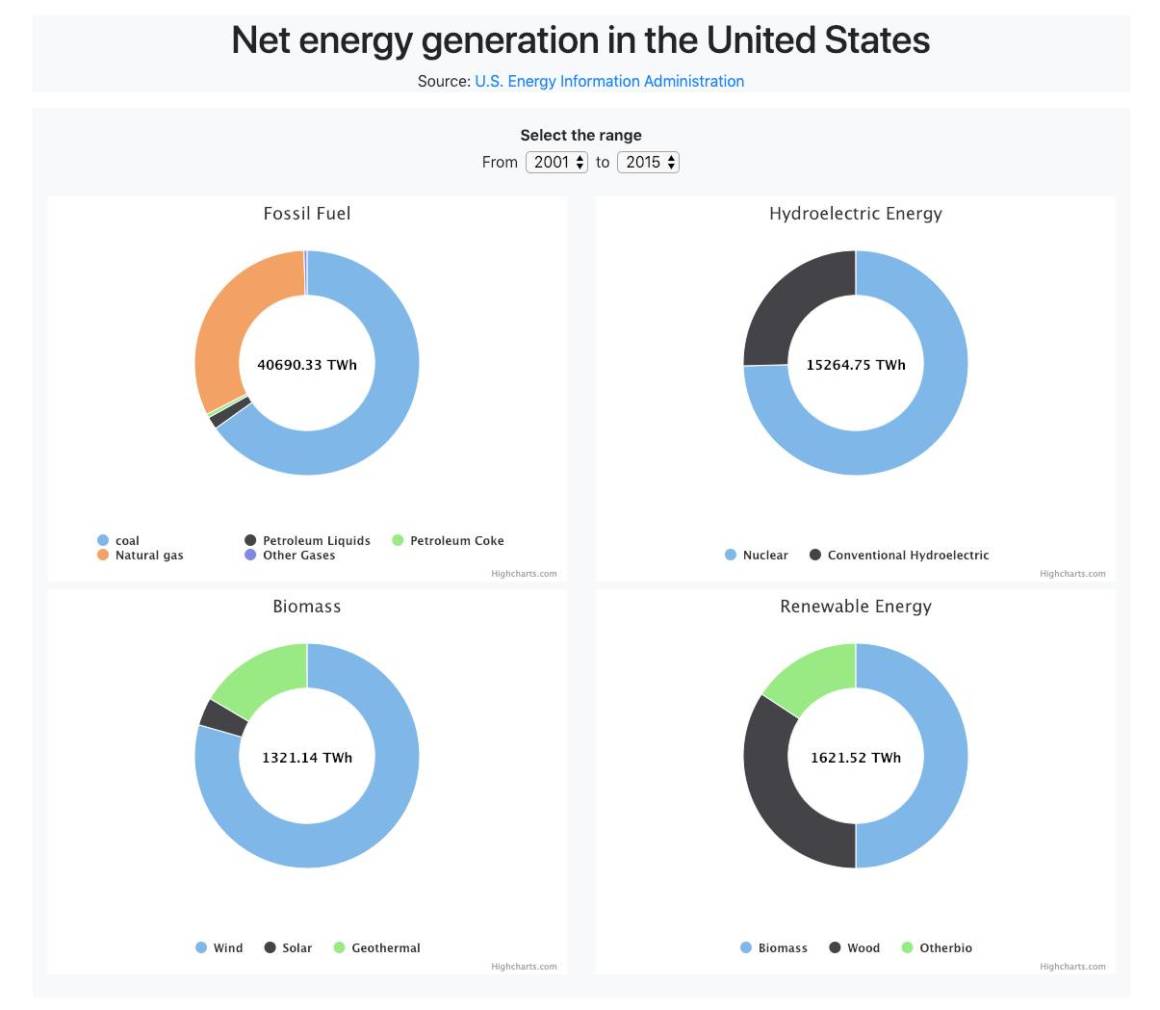
The dashboard below visualizes the net energy generation in the United States from 2001 to 2015. The dashboard allows the viewer to compare the main energy sources produced in the following categories fossil fuel, hydroelectric energy, biomass, and renewable energy. I collected the data from the U.S. Energy Information Administration also known as EIA.
In creating the dashboard, I followed these best practices:
- Separate background from the charts (i.e. use color to mark the boundaries of each chart widget)
- Keep the legend close to the charts
- Avoid crowded charts (i.e. break out important information into multiple charts, rather than cramming too much data into one chart)
- Provide tools to explore data (e.g. zooming and filtering)
- Think responsive design
To learn more about how to create an effective dashboard check the following article 6 Things to Consider Before Putting Charts Into a Dashboard; where you will find more details and demos about each point described above.
To check the live interactive dashboard click on the Codesandbox project link, or click on the picture below:
Let’s go through the process to create the dashboard!
The architecture
Let’s start by reviewing global architecture. Architecture planning helps show what the connections between components will be; it also visualizes the data flow. I strongly recommend to take some time planning your architecture before jumping to code; you will save a lot of time and hair pulling.
The main idea of this dashboard is relatively simple: A user selects date range via the UI, this action triggers the process to pull data from this date range, summarizes data by energy source, then categorizes the result into either a fossil fuel, Hydroelectric energy, Biomass or Renewable energy. The final step is to display the data into four interactive Donut charts, one for each category. By the way, Donut or Pie charts are great to show comparison and composition at a glance; there are compact and easy to understand; which is why they are so often used for dashboards.
My next logical action was to break down the idea into small components, to make it easier for me to code and to maintain each component. After a few sketches and optimizations, I ended up with seven components:
- Data component: to save the data collected from the EIA website.
- Data processing: To add up the data after the user selection.
- Chart template: To set up the interactive charts’ configurations required by the Highcharts library.
- Range selection component: To handle the date selectors used by the user.
- Chart module: To render the charts after each range selected by the user.
- Dashboard component: To gather and render all the chats on one container.
- The App component: To gather all the components and run the dashboard.
Then, I divided my project into seven components four ReactJS components (purple) and three modules (green). My criterium was simple; if there is anything to render, the component becomes ReactJS component, otherwise, it is just a standard javascript module where there is no rendering, just a bunch of objects or functions for data processing.

I had to add the Highcharts React Wrapper (blue) to the architecture to visualize and to know where I have to add the library to my project. And since the chart rendering is going to be in the Chart component, I imported the Highcharts React Wrapper to that component.
Coding … the fun part
After I set up the architecture, I created a new project using Create React App; then I added the folder components where I made a file for each component. To separate the ReactJS components from the other modules, I started the first letter of each ReactJS component file with an uppercase; it is a good practice to quickly recognize which file does what since it makes the import intuitive, and reduce any ambiguity among files.
Check below the project file structure:

Let’s explore each component in depth:
Data
The data module has an object data, where I store the data about each energy source in one dedicated object, then I export the object data using the export default data:
const data = {
 coal: {
   2001: 1903955,
...
 },
 pliquids: {
   2001: 114646,
...
 },
 pcoke: {
   2001: 10235,
...
 },
 ngas: {
   2001: 639129,
...
 },
 ogas: {
   2001: 9040,
...
 },
 nuclear: {
   2001: 768825,
...
 },
 chydroelectric: {
   2001: 216962,
...
 },
 wind: {
   2001: 6737,
...,
   2015: 93876
 },
 solar: {
   2001: 543,
...
 },
 geothermal: {
   2001: 13740,
...
 },
 biomass: {
   2001: 49749,
 ...
 },
 wood: {
   2001: 35199,
...
 },
 otherbio: {
   2001: 14549,
...
 }
};

export default data;
Data processing
This module imports the data from the data module then passes the data with the yearFrom and the yearTo as parameters to an arrow function dataProcessing.
import data from './data';
let dataProcessing = (yearFrom, yearTo) => {
...
The function calculates the amounts of energy produced during the date range for each energy source.
 if (yearFrom < yearTo) {
   let coal = 0,
     pliquids = 0,
     pcoke = 0,
     ngas = 0,
     ogas = 0,
     nuclear = 0,
     chydroelectric = 0,
     wind = 0,
     solar = 0,
     geothermal = 0,
     biomass = 0,
     wood = 0,
     otherbio = 0;
   for (let i = yearFrom; i < yearTo; i++) {
     coal += data.coal[i];
     pliquids += data.pliquids[i];
     pcoke += data.pcoke[i];
     ngas += data.ngas[i];
     ogas += data.ogas[i];
     nuclear += data.nuclear[i];
     chydroelectric += data.chydroelectric[i];
     wind += data.wind[i];
     solar += data.solar[i];
     geothermal += data.geothermal[i];
     biomass += data.biomass[i];
     wood += data.wood[i];
     otherbio += data.otherbio[i];
   }
The data calculated is saved in the four objects depending on the nature of the energy source:
 fossilFuelData = [
     { name: 'coal', y: coal },
     { name: 'Petroleum Liquids', y: pliquids },
     { name: 'Petroleum Coke', y: pcoke },
     { name: 'Natural gas', y: ngas },
     { name: 'Other Gases', y: ogas }
   ];

   hydroElectricData = [
     { name: 'Nuclear', y: nuclear },
     { name: 'Conventional Hydroelectric', y: chydroelectric }
   ];

   biomassData = [
     { name: 'Biomass', y: biomass },
     { name: 'Wood', y: wood },
     { name: 'Otherbio', y: otherbio }
   ];

   renewableEnergyData = [
     { name: 'Wind', y: wind },
     { name: 'Solar', y: solar },
     { name: 'Geothermal', y: geothermal }
   ];
The function also handles a message to indicated to the user to select the range, and to be sure that the yearFrom is always smaller or equal to the yearTo.
Template
The dashboard has four interactive donut charts, so instead of creating each chart separately, I set up one template module following the Highcharts library structure, then use it in the App module to create the charts.
const template = {
 userConfig: {
   tooltip: {
     pointFormat: "{point.y} thousand megawatthours"
   },
   plotOptions: {
     pie: {
       showInLegend: true,
       innerSize: "60%",
       dataLabels: {
         enabled: false,
         distance: -14,
         color: "white",
         style: {
           fontweight: "bold",
           fontsize: 50
         }
       }
     }
   }
 },
 yearFrom: "2001",
 yearTo: "2015",
 msg: "Select the range"
};

export default template;
As you can see, the template has the main standard Highchart chart’s configuration such as the tooltip and the plotOptions.
Selection
This file is a ReactJS component; it renders the select elements that allow the user to choose the date range.

For this component, I use Bootstrap to style the elements, you are free to come up with your own style, but again for the sake of the maintainability, I decided to go with a standard styling library.
Chart
The Chart.js file is another ReactJS component; it renders the charts each time there is an update.
The key element in this component is the componentDidUpdate(prevProps, prevState) method; I use it to check if there is any update before fetching the new charts’ parameters, then passing those parameters to the Chart state component.
componentDidUpdate(prevProps, prevState) {
    if (this.props.data !== prevProps.data) {
      this.setState({
        chartData: {
          ...this.state.chartData,
          subtitle: {
            text:
              (
                this.props.data.reduce((accumulator, obj) => accumulator + obj.y,0) / 1000).toFixed(2) + " TWh"
          },
          series: [
            {
              data: this.props.data
            }
          ]
        }
      });
    }
  }
Dashboard
In this component, I render all the charts dynamically using the following code:
{this.props.charts && this.props.charts.map(chart => {
           return (
             <div className="col-xs-12 col-sm-6 mb-2" key={i}>
               <Chart
                 data={chart.serie}
                 userConfig={this.props.userConfig}
                 titleName={chart.title}
               />
             </div>
           );
         })}
App
Finally, I gather all the ReactJS components in this main component App.js to render the whole dashboard.
In this component, there is an arrow functions handleChangeYear:
handleChangeYear = e => {
              this.setState({
                  [e.target.name]: e.target.value
              });
};
The function handles events on the select elements and saves the new time range in the state of the component App.js; this process triggers the method componentDidUpdate(prevProps, prevState)
 componentDidUpdate(prevProps, prevState) {
   if (prevState.yearFrom !== this.state.yearFrom) {
     this.handleChangeSelect();
   }
   if (prevState.yearTo !== this.state.yearTo) {
     this.handleChangeSelect();
   }
 }
The component componentDidUpdate(prevProps, prevState) calls the handleChangeSelect() to process the data (in the data process module), then update the charts.
The last step in this entire process is to display the new charts on the dashboard.
In the App.js file, I also use Bootstrap to style the different elements that are displayed on the dashboard.
Once the project was done, I realized that the most challenging and the most time-consuming part was to figure out the architecture; after that, the code part was straightforward. I also had some challenges with the handleChangeYear; I had to use the bracket notation to be sure that I am handling the right button.
Well, that is it. I hope my experience will be helpful for you, and feel free to share your own experience with the wrapper, or leave a comment/question below, I will be happy to answer you.
Comments
There are no comments on this post
Want to leave a comment?
Comments are moderated. They will publish only if they add to the discussion in a constructive way. Please be polite.