
Interactive charts are an intuitive way to support your story with beautiful, responsive and dynamic content. Guess what! It is easy to create an interactive chart and even easier to embed them on your favorite blog or website.
This article will guide you step by step (with pictures and videos) from how to make a chart to how to share it on your blog or website.
This article is organized into two parts, the first part provides instructions about how to create interactive charts, while the second part shows you how to embed them into your blog.
PART 1 – CREATE THE CHART
To start making interactive charts, go to cloud.highcharts.com, and click “Get started now”.
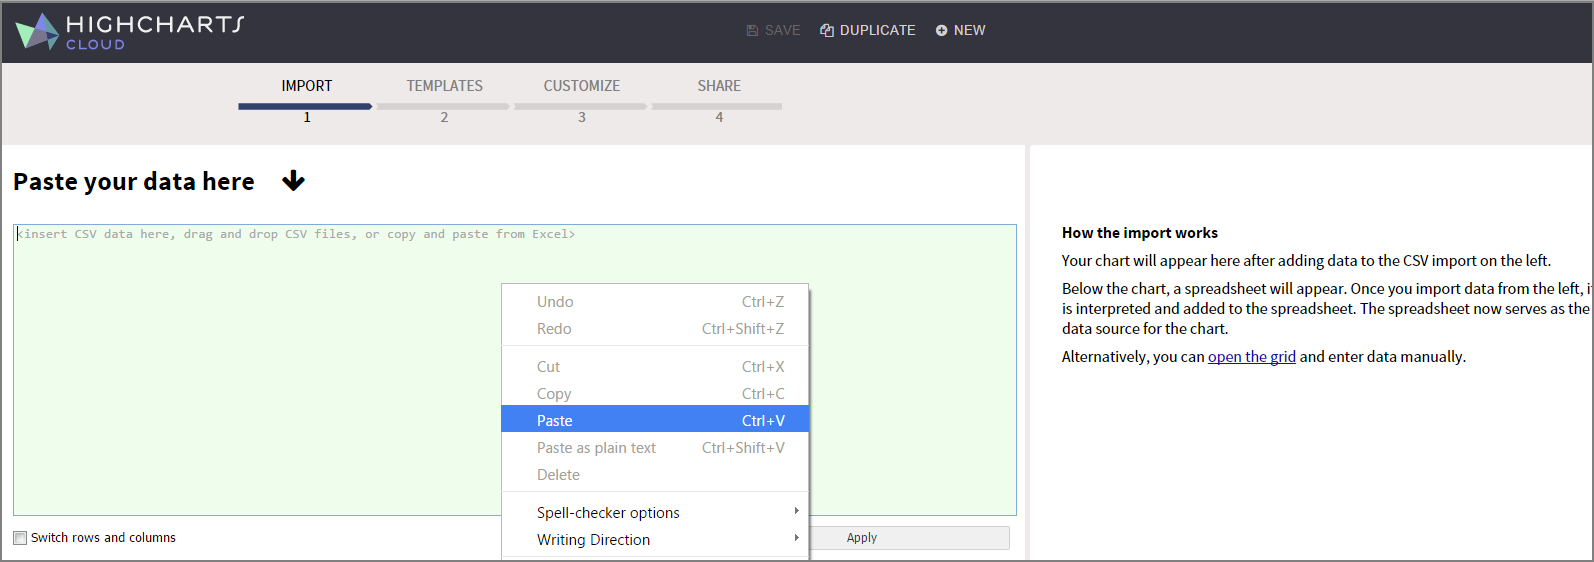
Drag and drop your CSV file (or copy/paste your data from Excel file) in the data section (watch video).
To learn more about how to set up a CSV file, read more in our docs.
Drag and drop your CSV file in the Import section (watch video).
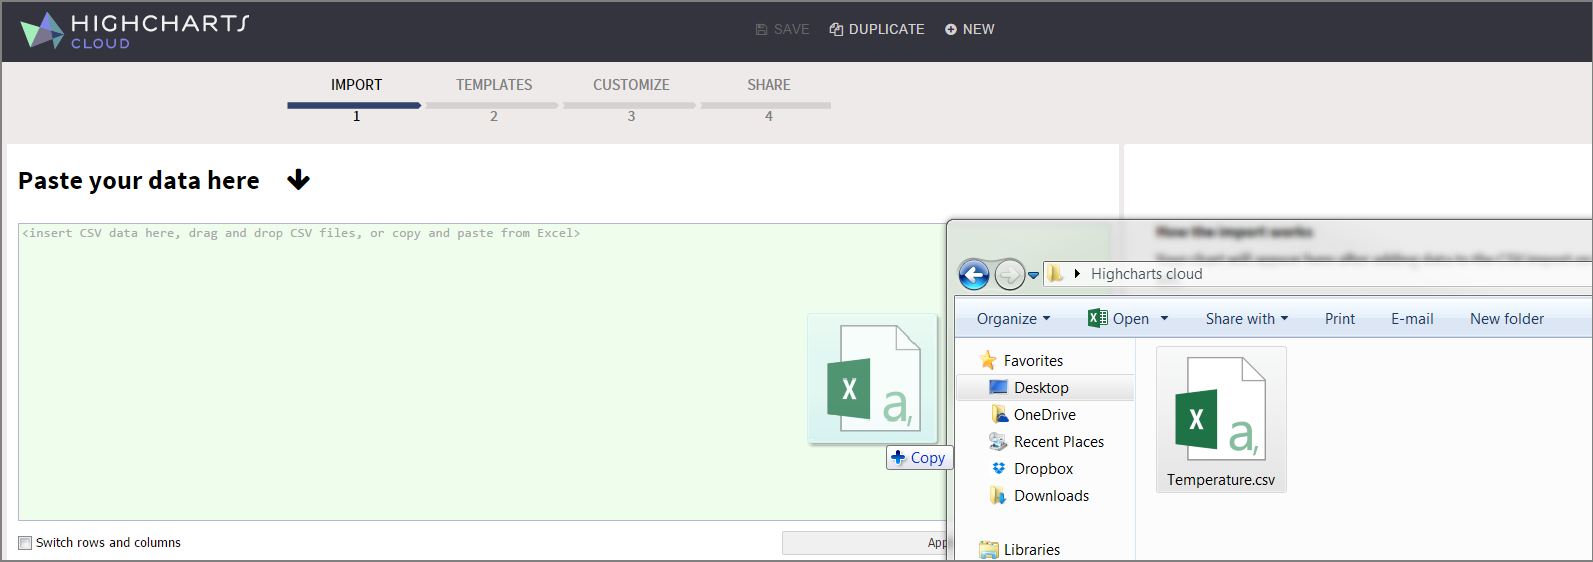
Or copy/paste your data from Excel file in the Import section.
Click Templates section, and select any templates that best suits you.

Customize your charts in the Customize section (watch video)

Click on the Save button and go to Share section

PART 2 – ADD IT TO WORDPRESS
Once your interactive charts is set up, all you have to do is to copy the embed code and paste it on your blog (watch video).
To do that, go to the Embed section (under the SHARE section), and copy the embed code.

On your WordPress page click on Text.

Paste the Embed code into the page (be sure to select the right spot).

And Voila! An interactive chart to make your blog more attractive.
Comments
Odya | 3 years ago
Where is the code.highcharts, i can’t find iframe generator
Mustapha Mekhatria | 3 years ago
Hi,
Highcharts cloud is now Everviz. Feel free to check the link https://app.everviz.com/
Dex | 3 years ago
It is possible to filter data if I embed chart to WordPress site ?
Mustapha Mekhatria | 3 years ago
Hi,
It is better to filter your data before the visualisation process.
Want to leave a comment?
Comments are moderated. They will publish only if they add to the discussion in a constructive way. Please be polite.