
We’re proud to announce the Beta release of Highmaps, the mapping component for Highcharts. Highmaps allows creation of interactive and standards compliant maps with the well-known ease of use from Highcharts.
Developed for the mobile web, Highmaps works great along with Highcharts for interactive dashboards, or standalone for geo maps or heat maps.
RESOURCES
- View the demos at www.highcharts.com/maps/demo.
- Read the docs at www.highcharts.com/docs/maps.
- Read the full API reference and view 101 samples at api.highcharts.com/highmaps.
- Download the zip package. You can also run the files directly from
https://code.highcharts.com/maps/, like for examplehttps://code.highcharts.com/maps/highmaps.js.
DEMO
FEATURES
 MOBILE-FRIENDLY
Highmaps is designed from ground up with mobile browsers in mind. Everything from multitouch zooming to touch-friendly tooltips responds great on mobile platforms. Nevertheless, Highmaps also works in old browsers like IE6-8.
VARIOUS MAP TYPES
Map area, map line, points of interest, bubbles on maps, heatmaps. These features correspond to series types in Highcharts.
 COLOR AXIS
For full control over the color layout of the Highmaps choropleth maps, a separate color axis is displayed inside the legend. It inherits most features from scalar axes in order to provide common options like min, max, logarithmic scale, and more.
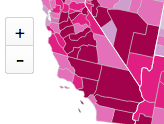 NAVIGATION
Highmaps features all common ways of navigating, like plus/minus buttons, double click to zoom, mouse wheel zooming, multitouch, and panning.
 DRILLDOWN
The drilldown module ensures smooth interaction between map areas on one layer, which zooms into a full map on the underlying layer. Let your users click their way down into increasingly local data!
 DYNAMIC
Like Highcharts, Highmaps support full dynamic access to add, update or delete points/areas, series, etc.
 GEOJSON SUPPORT
Besides the common Series/Point concept, Highmaps accepts the standardized GeoJSON format for map input.
Comments
There are no comments on this post
Want to leave a comment?
Comments are moderated. They will publish only if they add to the discussion in a constructive way. Please be polite.